


This last post of 2022 will also be the final one of my “Climate Journeys” series—part summary, part new twist.
I’ve been describing continental and global patterns of climate zonation with a focus on linear “journeys” across them because my primary interest is in personal experiences of these patterns—my own (so far and maybe to come) or more generally. The reason I find these experiences exciting to begin with is connected to the underlying theme of this entire blog and my entire body of work: the empowering “world-at-my-fingertips” sensation I (and others too?…an ongoing question) experience from seemingly “compressed,” more “knowable” versions of environmental spaces and phenomena that we typically think of as being larger-than-life. (In a conservation context this “empowerment” idea becomes a little loaded, something I’ve brought up before and will be getting back to in later posts.) Climatic variation, typically operating on scales of hundreds or thousands of miles, is an example of these larger-than-life phenomena, and it can be “compressed” in a few different ways.
One way—the subject of most of the blog and work—is through topography, which can create sharp temperature and rainfall gradients across divides or climbing mountain slopes. The aim of many of the worldviews is to heighten this type of miniaturization even further. This post, though, will focus on cases where oceanic and meteorological patterns are compressed without the influence of topography. As I’ve written before, this second type is arguably more impressive for the very reason that elevation isn’t involved, even if the down-scaling isn’t quite as extreme as, say, in crossing between the leeward and windward sides of certain Hawaiian islands. (Like the topographical kind it could also be accentuated virtually, through some sort of sampling along a transect or maybe speeding up in film; I went into some of the possibilities in my earlier “Long Gradients” series and so won’t get into it further here.)
I’ve already described one example of non-topographical compression—the roughly 1200km/800mi transition from the Peruvian desert (less than 2” of rainfall—not as dry as the Atacama but perceptually not that different) to what’s probably the world’s wettest low-elevation rainforest on the southern Colombian coast with over 200.” That’s about the length of the state of California, though the most perceptibly dramatic part of the gradient, from the northern edge of the desert to the southern edge of the rainforest, from the maps at least seems to be squeezed into only about half that distance. (As I said earlier my on-the-ground experience wasn’t quite so dramatic, but that was probably a function of the time of year and the particular route taken.) To simplify a bit this second time around, essentially the cold Humboldt Current pulls the South American coastal desert northward far beyond what would be predicted by latitude, while the wet zones shift northward to a much smaller degree. It’s the ocean temperatures, then, that are “compressed.”

Vegetation and rainfall variation between northern Peru and southern Colombia. (Vegetation map adapted from Trewartha, The Earth’s Climates; rainfall map adapted from various sources.)
Another example, closer to home for most of us, is also related to ocean temperatures. The Gulf Stream/North Atlantic Drift, which gives most of Europe much milder winters than would otherwise be expected based on latitude, heads away from the North American coast at Cape Hatteras, North Carolina. North of there, as the coastline bends counter-clockwise, ocean temperatures quickly “catch up” to something like where they otherwise would have been. This compressed temperature gradient is basically the inverse (warm to cool) of the situation in the first example, where the “bulge” of northwestern South America forces the cold Humboldt current westward out to sea.

North Atlantic surface temperatures (from https://www.propilotmag.com/north-atlantic/).
But in the South American example the corresponding effect on the land in terms of climate (precipitation in that case) and vegetation is dramatic. In North America, while there is a perceptible shift in native and cultivated vegetation between Cape Hatteras and the Delmarva Peninsula (palmettos and Spanish moss disappear, for example), the terrestrial effect isn’t quite what the ocean temperature map would suggest. One reason is that the Gulf Stream doesn’t have anywhere near as strong an influence on land temperatures in North America as the North Atlantic Drift (its eastern continuation) does in Europe. The current gives the Isles of Scilly at the tip of southwestern England about the same average winter lows as Jacksonville, Florida, rather than making both climates correspondingly milder. The main reason for the uneven effect is, as I’ve talked about before, the westerly direction of the prevailing winds—blowing over land along the east coast of North America but over water along the coast of Western Europe. Another reason, if you look more closely at the map, is that north of South Florida the heart of the Gulf Stream (in red) actually flows a ways offshore.
The current does, though, have a significant warming effect on one particular piece of land in the western Atlantic—Bermuda. It isn’t located in the warmest part of the current either but the winds from the west do have an expanse of water to blow over, giving the island a borderline tropical climate with winter lows similar to West Palm Beach despite its being at the same latitude as the Georgia-South Carolina border. A former design colleague and fellow plant enthusiast of mine, Brett Desmarais, and I frequently geek out on anomalies in vegetation/hardiness zones; at some point we came up with the idea of a hypothetical archipelago (“Nantuda”) that would make the compressed warm-cool water temperature gradient between Bermuda and Nantucket perceptible on land. Brett came up with a layout of five islands “protruding” from an actual range of seamounts.

The imaginary Nantuda Archipelago (base image from Google Maps).

Using those seamounts for some element of geological realism (it’s no stretch to imagine them poking above the surface) doesn’t ending up bridging the main part of the gradient. Brett figured out that the northernmost island of the chain would be in USDA Hardiness Zone 9A, equivalent to southern coastal South Carolina to north Florida—still quite a ways, climate-wise, from Nantucket. But that location would bring those subtropical climates, with native palmettos, Southern magnolias, live oaks, and a few large beachside succulents all the way up to the latitude of southern New Jersey, creating some sense of climatic compression by bringing the near-extremes closer together.
Abandoning any pretense of geological reality, though, brings up another possible alignment that could make the gradient even more visible and dramatic. The southernmost island in this version, in line with Cape Hatteras, could have roughly the same climate and vegetation as Bermuda and/or South Florida (maybe more the latter, given proximity to the mainland) with mangroves and coconut palms, while the northernmost (in line with northern New Jersey) might be similar to the southern coast of Virginia with Spanish moss and live oaks. So, dividing that degree of contrast into four segments, the change in vegetation from island to island would be relatively apparent, plus there would be a borderline subtropical climate less than 100 miles from Nantucket.
It’s likely, though, that this configuration wouldn’t in fact result in such a mild overall climate compared to the first version. The islands probably wouldn’t be far enough away from the mainland for the water to have a such a significant influence, not only terms of the relatively narrow expanse of warm water to the west but also to the north, another factor that helps explain southeastern North America’s cold winters relative to Western Europe’s (and Bermuda’s). Independent of the current, there would be little water to moderate intrusions of polar air after they pass over the American landmass, whereas there’s quite a bit of ocean buffering western Europe from the Arctic.

Another imaginary archipelago alignment that might better capture the compressed ocean temperature gradient on land.

The location of Shark Fin Island with the botanical origins of its flora.
I’ll finish up with another hypothetical example, one that I described in more detail (with more imagery) in an earlier post but that might take on more clarity or relevance in this discussion of global climate patterns. It's a single island, Shark Fin Island, that I invented for a design-your-own-island competition, representing an even more compressed version of these imaginary archipelagos. It’s located in the same zone of compressed ocean temperatures but farther to the northeast, at the latitude of Nova Scotia, where I imagine a single point of convergence between not only 1) temperate, subtropical, and even a few tropical species ranges (the last one probably quite a stretch now that I think about it) but also 2) between North American “east coast” continental, and wetter northern European “west coast” oceanic, climates and species.
Against the rules of this current theme, Shark Fin Island does have a topographical element, and a pretty dramatic one because of the maximum allowed island area of 1km: to accommodate that east-west convergence I needed to give the island both dry (lowland) and wet (highland) zones. The latter zone also has some Western Hemisphere tropical cloud forest species thrown in for good measure.
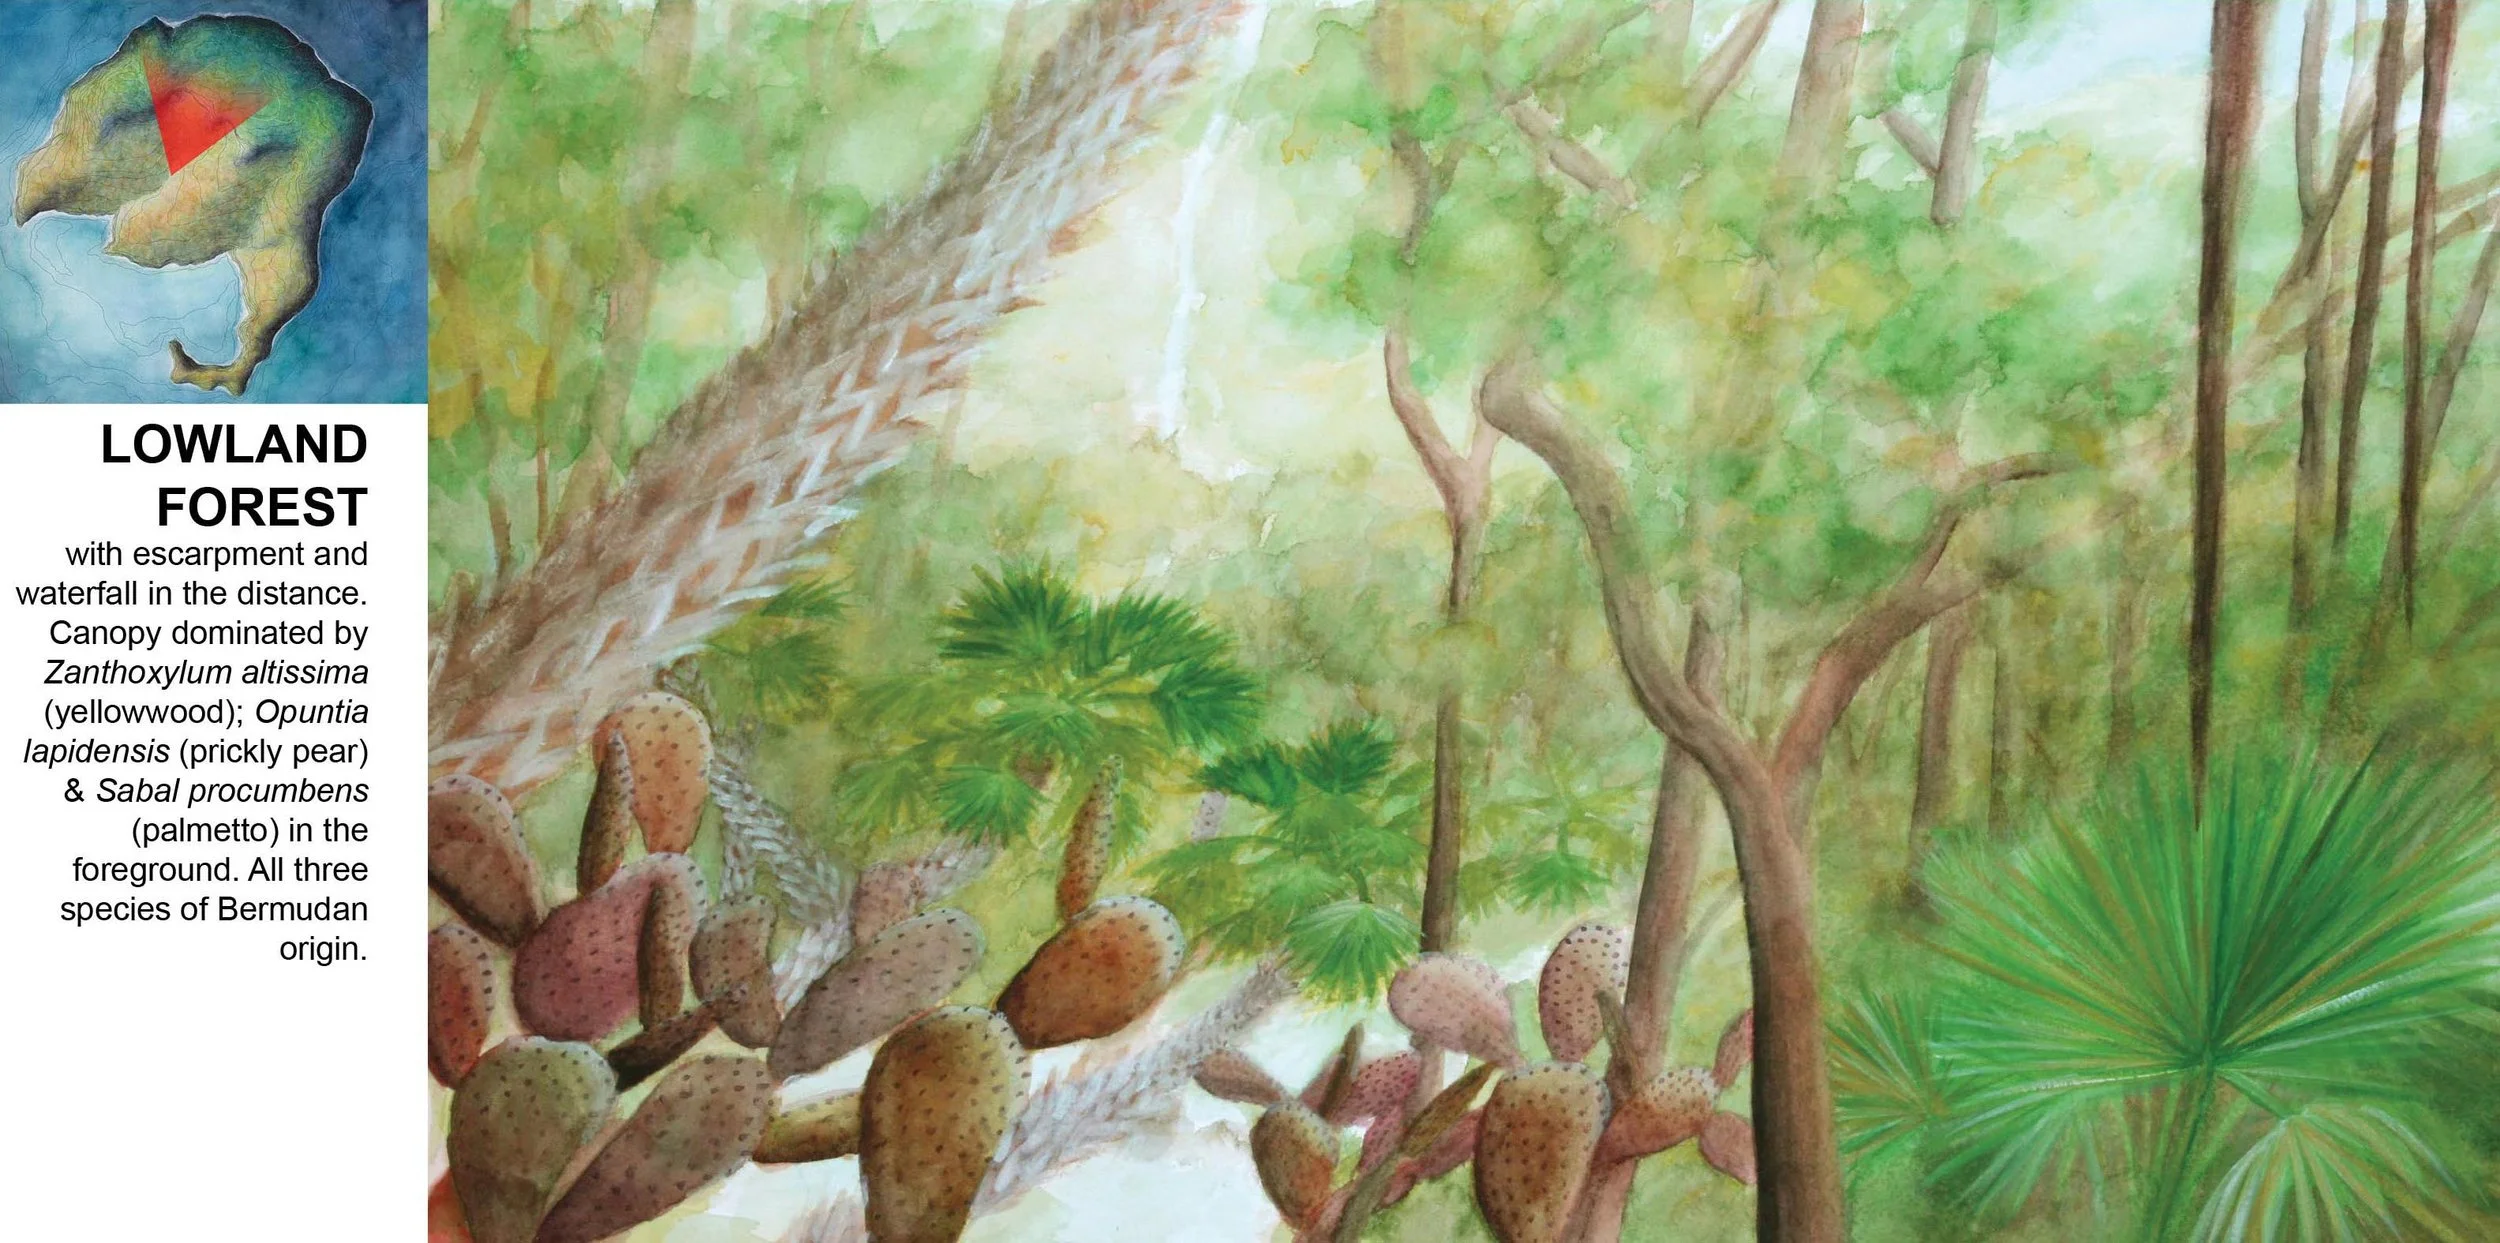
Shark Fin Island’s lowland forest zone (watercolor on paper, 14”x22”); note that the plants in the description are invented as well.

The island’s wetter highland forest zone (watercolor on paper, 14”x22”).
The thick dashed lines in the diagram above, between biogeographic realms, are abstracted in order to emphasize the idea of confluence. The “boundaries” between realms (as between ecoregions) are actually much broader transition zones, because the species that together characterize a given ecological zone of course don’t have ranges that all line up neatly. So Shark Fin Island would probably be no more likely than any one of the islands in the archipelago examples to “capture” such a significant “edge,” a place where the ranges of many species happen to “end” and the ranges of many others happen to “begin.” These compressed experiences have their limits; whether across a series of islands or a single landmass, they still require some amount of journeying.
Darren