Climate Journeys | Compressed

This last post of 2022 will also be the final one of my “Climate Journeys” series—part summary, part new twist.

I’ve been describing continental and global patterns of climate zonation with a focus on linear “journeys” across them because my primary interest is in personal experiences of these patterns—my own (so far and maybe to come) or more generally. The reason I find these experiences exciting to begin with is connected to the underlying theme of this entire blog and my entire body of work: the empowering “world-at-my-fingertips” sensation I (and others too?…an ongoing question) experience from seemingly “compressed,” more “knowable” versions of environmental spaces and phenomena that we typically think of as being larger-than-life. (In a conservation context this “empowerment” idea becomes a little loaded, something I’ve brought up before and will be getting back to in later posts.) Climatic variation, typically operating on scales of hundreds or thousands of miles, is an example of these larger-than-life phenomena, and it can be “compressed” in a few different ways.

One way—the subject of most of the blog and work—is through topography, which can create sharp temperature and rainfall gradients across divides or climbing mountain slopes. The aim of many of the worldviews is to heighten this type of miniaturization even further. This post, though, will focus on cases where oceanic and meteorological patterns are compressed without the influence of topography. As I’ve written before, this second type is arguably more impressive for the very reason that elevation isn’t involved, even if the down-scaling isn’t quite as extreme as, say, in crossing between the leeward and windward sides of certain Hawaiian islands. (Like the topographical kind it could also be accentuated virtually, through some sort of sampling along a transect or maybe speeding up in film; I went into some of the possibilities in my earlier “Long Gradients” series and so won’t get into it further here.)

I’ve already described one example of non-topographical compression—the roughly 1200km/800mi transition from the Peruvian desert (less than 2” of rainfall—not as dry as the Atacama but perceptually not that different) to what’s probably the world’s wettest low-elevation rainforest on the southern Colombian coast with over 200.” That’s about the length of the state of California, though the most perceptibly dramatic part of the gradient, from the northern edge of the desert to the southern edge of the rainforest, from the maps at least seems to be squeezed into only about half that distance. (As I said earlier my on-the-ground experience wasn’t quite so dramatic, but that was probably a function of the time of year and the particular route taken.) To simplify a bit this second time around, essentially the cold Humboldt Current pulls the South American coastal desert northward far beyond what would be predicted by latitude, while the wet zones shift northward to a much smaller degree. It’s the ocean temperatures, then, that are “compressed.”

Vegetation and rainfall variation between northern Peru and southern Colombia. (Vegetation map adapted from Trewartha, The Earth’s Climates; rainfall map adapted from various sources.)

Another example, closer to home for most of us, is also related to ocean temperatures. The Gulf Stream/North Atlantic Drift, which gives most of Europe much milder winters than would otherwise be expected based on latitude, heads away from the North American coast at Cape Hatteras, North Carolina. North of there, as the coastline bends counter-clockwise, ocean temperatures quickly “catch up” to something like where they otherwise would have been. This compressed temperature gradient is basically the inverse (warm to cool) of the situation in the first example, where the “bulge” of northwestern South America forces the cold Humboldt current westward out to sea.

North Atlantic surface temperatures (from https://www.propilotmag.com/north-atlantic/).

But in the South American example the corresponding effect on the land in terms of climate (precipitation in that case) and vegetation is dramatic. In North America, while there is a perceptible shift in native and cultivated vegetation between Cape Hatteras and the Delmarva Peninsula (palmettos and Spanish moss disappear, for example), the terrestrial effect isn’t quite what the ocean temperature map would suggest. One reason is that the Gulf Stream doesn’t have anywhere near as strong an influence on land temperatures in North America as the North Atlantic Drift (its eastern continuation) does in Europe. The current gives the Isles of Scilly at the tip of southwestern England about the same average winter lows as Jacksonville, Florida, rather than making both climates correspondingly milder. The main reason for the uneven effect is, as I’ve talked about before, the westerly direction of the prevailing winds—blowing over land along the east coast of North America but over water along the coast of Western Europe. Another reason, if you look more closely at the map, is that north of South Florida the heart of the Gulf Stream (in red) actually flows a ways offshore.

The current does, though, have a significant warming effect on one particular piece of land in the western Atlantic—Bermuda. It isn’t located in the warmest part of the current either but the winds from the west do have an expanse of water to blow over, giving the island a borderline tropical climate with winter lows similar to West Palm Beach despite its being at the same latitude as the Georgia-South Carolina border. A former design colleague and fellow plant enthusiast of mine, Brett Desmarais, and I frequently geek out on anomalies in vegetation/hardiness zones; at some point we came up with the idea of a hypothetical archipelago (“Nantuda”) that would make the compressed warm-cool water temperature gradient between Bermuda and Nantucket perceptible on land. Brett came up with a layout of five islands “protruding” from an actual range of seamounts.

The imaginary Nantuda Archipelago (base image from Google Maps).

Using those seamounts for some element of geological realism (it’s no stretch to imagine them poking above the surface) doesn’t ending up bridging the main part of the gradient. Brett figured out that the northernmost island of the chain would be in USDA Hardiness Zone 9A, equivalent to southern coastal South Carolina to north Florida—still quite a ways, climate-wise, from Nantucket. But that location would bring those subtropical climates, with native palmettos, Southern magnolias, live oaks, and a few large beachside succulents all the way up to the latitude of southern New Jersey, creating some sense of climatic compression by bringing the near-extremes closer together.

Abandoning any pretense of geological reality, though, brings up another possible alignment that could make the gradient even more visible and dramatic. The southernmost island in this version, in line with Cape Hatteras, could have roughly the same climate and vegetation as Bermuda and/or South Florida (maybe more the latter, given proximity to the mainland) with mangroves and coconut palms, while the northernmost (in line with northern New Jersey) might be similar to the southern coast of Virginia with Spanish moss and live oaks. So, dividing that degree of contrast into four segments, the change in vegetation from island to island would be relatively apparent, plus there would be a borderline subtropical climate less than 100 miles from Nantucket.

It’s likely, though, that this configuration wouldn’t in fact result in such a mild overall climate compared to the first version. The islands probably wouldn’t be far enough away from the mainland for the water to have a such a significant influence, not only terms of the relatively narrow expanse of warm water to the west but also to the north, another factor that helps explain southeastern North America’s cold winters relative to Western Europe’s (and Bermuda’s). Independent of the current, there would be little water to moderate intrusions of polar air after they pass over the American landmass, whereas there’s quite a bit of ocean buffering western Europe from the Arctic.

Another imaginary archipelago alignment that might better capture the compressed ocean temperature gradient on land.

The location of Shark Fin Island with the botanical origins of its flora.

I’ll finish up with another hypothetical example, one that I described in more detail (with more imagery) in an earlier post but that might take on more clarity or relevance in this discussion of global climate patterns. It's a single island, Shark Fin Island, that I invented for a design-your-own-island competition, representing an even more compressed version of these imaginary archipelagos. It’s located in the same zone of compressed ocean temperatures but farther to the northeast, at the latitude of Nova Scotia, where I imagine a single point of convergence between not only 1) temperate, subtropical, and even a few tropical species ranges (the last one probably quite a stretch now that I think about it) but also 2) between North American “east coast” continental, and wetter northern European “west coast” oceanic, climates and species.

Against the rules of this current theme, Shark Fin Island does have a topographical element, and a pretty dramatic one because of the maximum allowed island area of 1km: to accommodate that east-west convergence I needed to give the island both dry (lowland) and wet (highland) zones. The latter zone also has some Western Hemisphere tropical cloud forest species thrown in for good measure.

Shark Fin Island’s lowland forest zone (watercolor on paper, 14”x22”); note that the plants in the description are invented as well.

The island’s wetter highland forest zone (watercolor on paper, 14”x22”).

The thick dashed lines in the diagram above, between biogeographic realms, are abstracted in order to emphasize the idea of confluence. The “boundaries” between realms (as between ecoregions) are actually much broader transition zones, because the species that together characterize a given ecological zone of course don’t have ranges that all line up neatly. So Shark Fin Island would probably be no more likely than any one of the islands in the archipelago examples to “capture” such a significant “edge,” a place where the ranges of many species happen to “end” and the ranges of many others happen to “begin.” These compressed experiences have their limits; whether across a series of islands or a single landmass, they still require some amount of journeying.

Darren

Lord Howe Island

The worldview I’m now in the process of mapping out is based on what might be my favorite place on earth (to the extent I can say that after having spent only five days there, back in 2009). It’s Lord Howe Island, Australia, roughly 800km northeast of Sydney and southeast of Brisbane. The watercolor won’t be done for a few months, but since my descriptions of a place and the work it inspired rarely fit into a single post anyways, in this one I’m going to go ahead and cover the first part, maybe stirring up some anticipation….

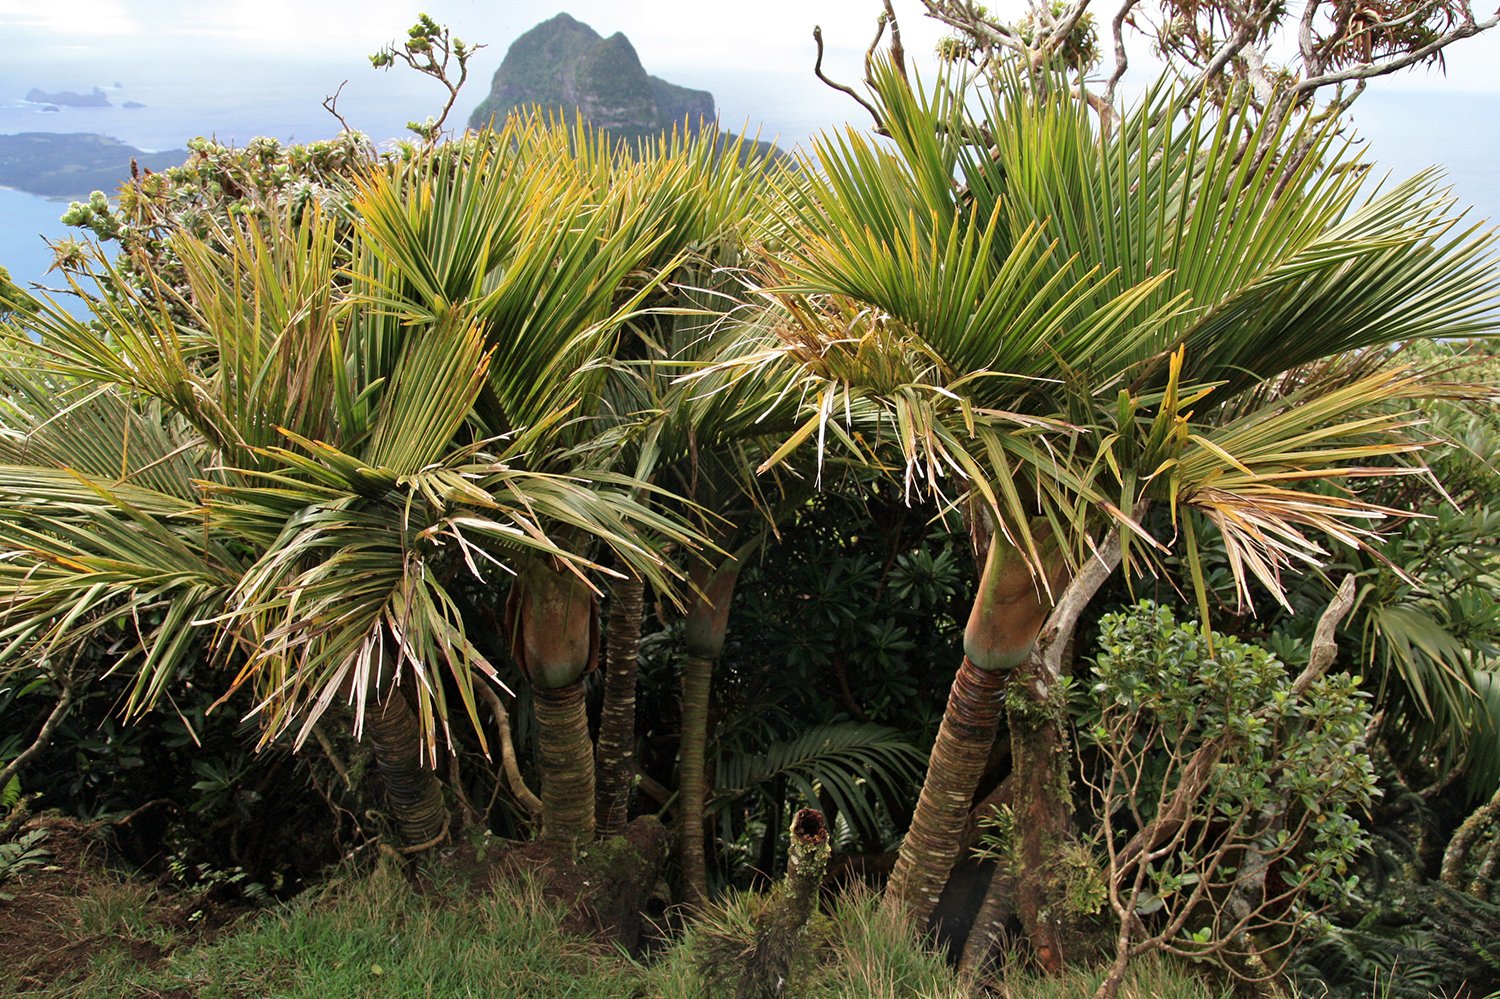
Kentia palm forest at the base of Mount Gower on Lord Howe Island, Australia.

A forest of the endemic kentia palm, Howea forstereana, at the base of Mt. Gower at the island’s southern end.

Lord Howe is in some ways the quintessential South Pacific island, with turquoise coral lagoons, dense stands of palms, and craggy emerald mountains. Actually, though, its latitude is equivalent to southern Georgia (the state) and a confluence of warm and cold currents give it a unique mix of tropical and temperate elements. It has the world’s southernmost coral reefs, home to both temperate and tropical fish species; and, while those palms might look like coconuts from a distance, in fact coconut palms have never been grown there successfully. (This interesting climatic edge condition—or “tension zone” as I’ve called it— won’t be the theme of the watercolor, but it does relate to the “climate journeys” and “long gradients” that I’ve been writing about off and on for the past few years.)

The island is roughly 10km long and less than 2km wide on average. It stands out among tropical and subtropical islands for its native ecosystems being remarkably intact—90% of its original forest cover remains and around 80% of that is still relatively undisturbed. Most of the latter carpets the bulky southern half of the island (on the right in the image), still only around 2km wide, which squeezes in two cinematic 800m peaks—Mt. Gower and Mt. Lidgbird. The the upper reaches, especially the flat-ish summits that are mostly isolated by sheer cliffs, support a dense, stunted cloud forest with a “lost world” feel. It’s home to two endemic palm species each in their own genus, four endemic species of tree fern, the large and somewhat sinister Lord Howe Island currawong (an endemic subspecies) that still doesn’t seem to fear humans, and (at least according to my guide…I don’t think he was actually correct) the world’s largest heath and the world’s largest moss.

Lush, evocative mist forest near the summit of Mount Gower on Lord Howe Island, Australia.

Fairy tale-like cloud forest just below the summit of Mt. Gower.

A Lord Howe Island currawong in the island's lush mist forest near the summit of Mount Gower.

A fearless Lord Howe currawong (Strepera graculina crissalis).

Little mountain palm (Lepidorrhachis mooreana) in lush mist forest near the summit of Mt. Gower on Lord Howe Island, Australia.

A little mountain palm (Lepidorrhachis mooreana).

Little mountain palms (Lepidorrhachis mooreana) on the summit of Mount Gower on Lord Howe Island, Australia.

More little mountain palms, on the Mt. Gower summit.

Scenic view from the summit of Mount Gower on Lord Howe Island, Australia.

Me at the summit of Mt. Gower (the island’s highest point), with Mt. Lidgbird just beyond. The 8-hour hike from the coast was the toughest day hike I’ve ever done, especially the portion along a narrow ledge above 100m cliffs. (There was a rope, but it wasn’t much comfort.) No rock climbing, but parts of the hike got close.

In contrast, the skinnier northern half of the island has mostly flat (the location of the settled areas) or rolling topography. The forest at these lower elevations is considered “subtropical rainforest,” but it doesn’t feel very rainy compared to the mossy, drippy environment on the peaks. (In fact I’ve also seen it oxymoronically described as “dry rainforest.”) But much of it does still have a very tropical feel thanks to two other endemic palm species that tend to grow in much denser stands than the two mountain palms. One of these is the kentia palm, one of the world’s most popular houseplants and garden plants, the export of which is the island’s largest industry after tourism. The more rugged headlands at the northern tip of the island are covered by lower, scrubbier vegetation—probably because of thinner soil, but maybe also because clouds generated by the mountains have even less influence there.

Lush kentia palm forest (Howea forstereana) on Lord Howe Island, Australia.

Inside a stand of kentia palms, most common near sea level.

Curly palms (Howea balmoreana) on Lord Howe Island, Australia.

The fourth endemic palm, the curly palm (Howea balmoreana), concentrated at slightly higher elevations than the kentia.

Strangler fig in the rainforest of Lord Howe Island, Australia.

An endemic variety of strangler fig, Ficus macrophylla f. columnaris.

Pandanus forest on Lord Howe Island, Australia.

Another tropical-looking endemic, pandanus forsteri, most common along watercourses.

Rainforest on Lord Howe Island, Australia.

The low-elevation forest has a less exotic and luxuriant appearance in areas without the palms, pandanus, or strangler figs.

Cinematic view of Mount Gower and Mount Lidgbird across lagoon on Lord Howe Island, Australia.

The scrubbier northern tip of the island, with Mts. Gower (right) and Lidgbird in the distance across the lagoon.

The British were the first to visit Lord Howe, in the late 18th century (there’s no record of pre-European discovery), and following the usual pattern for islands it didn’t take long for several bird species to be hunted to extinction and for non-native mammals (goats and pigs) to be left there as a future food source. The island soon became a provisioning stop for the growing Pacific whaling industry, and was first permanently settled in 1834. In the following decades the decline of whaling, increasing scientific interest, tourism, and the growing horticultural importance of a native palm (requiring nurseries but no large plantations) seem to have elevated the status of the natural environment above what was typical for remote islands during that period.

Picturesque cattle pasture behind a beach on Lord Howe Island, Australia.

The small percentage of non-forested land is mostly cow pasture.

Today the resident population is about 350, and while tourism has become the island’s biggest industry only 400 visitors are allowed at any one time. Lord Howe has also been a remarkable success story in terms of reversing past ecological damage, especially for an inhabited island. Pigs, cats, and goats were eradicated in the last few decades of the 20th century, and rats and mice—the former responsible for additional extinctions—have been eliminated through an intensive (and very controversial) program of blanketing the island with poisoned bait by hand and helicopter in 2019. (When I was there ten years earlier I remember hearing that the plan was going to involve evacuating all people, cows, and—Noah’s Ark-style—representatives of endemic bird species during the process. That was apparently scaled back somewhat, with the residents and much of the cattle population remaining.) These eradications have led to a significant and perceptible rebound in native species populations. Also you might have read about the 15cm-long Lord Howe stick insect or “tree lobster” recently rediscovered under a bush on a nearby rock called Ball’s Pyramid—now it can likely be re-introduced on the main island where rats had wiped it out. Exotic plants are also an issue as on most islands, though there have been successful efforts at controlling invasive weeds, and on a more experiential level I remember non-native trees being rare in public areas of the settled zones. (The main exception was Norfolk pines, which bugged me particularly because they stood out so much.)

So compared to other inhabited, biologically significant islands I’ve visited (especially Robinson Crusoe, of somewhat comparable size and population yet almost entirely transformed or degraded), Lord Howe is exceptional. The indigenous landscape feels present everywhere; it hasn’t been reduced to tiny fragments that you need special guidance—or an actual guide—to find. (Getting to the cloud forest does require a guide, but not because it’s been destroyed in all the more accessible places.) The human elements that do exist are limited enough to be picturesque in a way—garden- or storybook-like.

Picturesque cemetery in palm forest on Lord Howe Island, Australia.

The island’s main cemetery.

Picturesque grassy seaside park with benches on Lord Howe Island, Australia.

A small waterfront park and memorial.

This sense of smallness, tameness, or “quaintness” goes beyond the cultural landscapes. To me the kentia palms look like coconut palms in miniature. The gnarled, fairy tale-like cloud forest isn’t to my knowledge called “elfin” forest but that description is applied to similar environments in other parts of the world, and the docility of the wildlife (I half expected the birds to start talking) only reinforces the image. Plus of course there’s the “miniature world”-like quality of the island as a whole—its tiny area combined with all the topographical and corresponding ecological variety crammed into it, and all the species found nowhere else (I’ve only mentioned a few of them). The difficulty of the Mt. Gower climb felt misplaced in a way.

I probably don’t need to reiterate that this “world-at-my-fingertips” quality, overlaid with a sense of fragility, is a common theme in the worldviews, and the one I’ve just begun will be no exception. (For the sake of simplicity it won’t deal with the constructed landscape component, though a later one might—in the vein of others that have focused on the built-”natural” juxtaposition.) To be continued!

Darren

For more information on the Lord Howe environment, especially relating to conservation measures, check out these links that I’ve drawn from:

The Lord Howe Island Rodent Eradication: Lessons Learnt from an Inhabited Island

Lord Howe Island Rodent Eradication Project

Lord Howe Island: Return of the Tree Lobster

Climate Journeys | Eurasia

My final post on “real world” climate journeys (there are still some “imaginary” examples to come!) will be a little briefer than usual since it focuses on a region that I and probably most of us have experienced much more in terms of built environments than natural ones, let alone relatively intact, native ecosystems—western Eurasia. By this I mean Europe and everything eastward to the Central Asian deserts, the latter which many fewer of us know at all from experience (myself included).

At the beginning of this series I shared a map of typical climate zones on a “generic” continent and three types of journeys or linear experiences through those zones. But that continent is actually most similar to North America: it spans all the zones from polar to tropical, and in fact assumes the presence of mountains between the three “oceanic” west coast zones and the semi-desert/desert zones just to the east. Below I’ve added a dashed white line to that diagram to indicate that set of mountain ranges—from south to north representing the Peninsular, Transverse, Sierra Nevada, Cascade, Coast, and Alaska Ranges. These ranges explain why the three west coast climate zones have a relatively narrow east-west extent and transition abruptly to the Great Basin, Mojave, and Colorado Deserts, which exist where they do in part thanks to the rain-shadow effect of those mountains.

Europe, though, has no real equivalent to those topographical barriers, except for the Scandinavian Mountains; the ranges on the Continent generally run east-west. So, the west coast climate zones—with their north-south wet-to-dry gradient, their mild winters, and (toward the north) their mild summers—extend far westward into Central Europe. The warm waters of the Mediterranean also contribute to that condition. (As in the rest of this series these general concepts are discussed in Glenn Trewartha’s The Earth’s Problem Climates.)

So traveling eastward, with no mountain barrier, the climatic influence of the Atlantic peters out gradually. And in particular the “temperate rainforest” zone (again, emphatically, these terms are generalizations…where forest still exists in Northern Europe only tiny pockets are actually that wet) of course does not give way directly to aridity but rather the marginally less rainy temperate forests of Central and Eastern Europe. (On the mainland the subpolar rainforest zone is still restricted to a narrow strip along the Norwegian coast by the Scandinavian Mountains.) So unlike in North America there’s a piece of the temperate forest zone, highlighted below, to the west of the dry regions as well as to the east. Moving even farther east, moisture from the Atlantic continues to drop off as the forests give way to the Central Asian steppes and deserts.

A revised version of the generic diagram, modified just enough to fit the Eurasian pattern; the specific locations mentioned are only examples. (If you take out the Mediterranean, you could say this version is actually closer to “generic” than the earlier one since it incorporates fewer effects of topography.)

The pattern as it actually looks, again with that anomalous temperate forest region highlighted.

Connecting the black arrows in the diagrams above, you end up with a modified, partly inverted version of the original “cross-continental” type journey. These transitions from the temperate rainforest and subtropical shrubland (Mediterranean) zones to the temperate forest zone don’t exist anywhere else in the world. Given the almost completely humanized state of the European environment they’re far from smooth or obvious; the transition between the two temperate forest types would be subtle even if it still existed to any perceptible extent. But picture the California chaparral or the Pacific Northwest rainforests fading directly into the forests of the Midwest—I think the Eurasian equivalent of that would be an interesting experience at least in theory.

I’m short on photographs (taken by me) from natural areas in this part of the world, let alone anything close to a transect, and have none from Central/Eastern Europe or eastward. But since quasi-native vegetation isn’t the focus for most of us when we go to these regions, I thought it could be illuminating to end with a few examples that I went out of my way to find….

Darren

European fan palms in the scrubby rugged landscape of San Vito lo Capo in Sicily.

Mediterranean fan palms (Chamaerops humilis) at San Vito lo Capo, Sicily—in cultivation they can grow into short trees, but in their rocky native habitats from Spain and North Africa to Italy they tend to stay shrub-like.

Gnarled oaks in the evocative Celtic rainforest of Wistman’s Wood in Dartmoor in Devon, UK.

Gnarled oaks in Wistman’s Wood in Dartmoor, Devon, UK—probably classified as a little remnant of temperate rainforest.

Birches in the subpolar rainforest of Thorsmork in Iceland.

Birch forest at Thorsmork, southern Iceland—likely wet enough to qualify as subpolar rainforest. Birch used to cover a much larger percentage of the country’s lowlands, though more shrub-like in most places.

Crystallize

Austere and surreal landscape of giant cacti on Isla Incahuasi in the Salar de Uyuni, Bolivia.

My latest (and to date, largest) worldview is inspired by one of the most surreal places I’ve been—Isla Incahuasi in the Salar de Uyuni, the world’s largest salt pan at 3,656m (11,995’) elevation in the Bolivian altiplano. (It’s a rocky outcrop, the top of an ancient “submerged” volcano, that becomes an island in the strict sense after infrequent rain turns the Salar into the world’s largest mirror.) The place is otherworldly in multiple ways: the giant cacti, looking simultaneously menacing and cuddly, studding the island; the blank, perfectly flat expanse of salt beyond; and most strikingly the sharp contrast between the two in terms of color, texture, and terrain.

Location of the Salar de Uyuni (Google Maps image).

The Salar is roughly 110km by 80km (70mi by 50mi), clearly visible on an aerial photo of the entire continent; Isla Incahuasi is a tiny speck close to the center, only about half a kilometer across. Walking the island’s one loop trail to the 150m summit, along with the entire perimeter, can be done in about an hour.

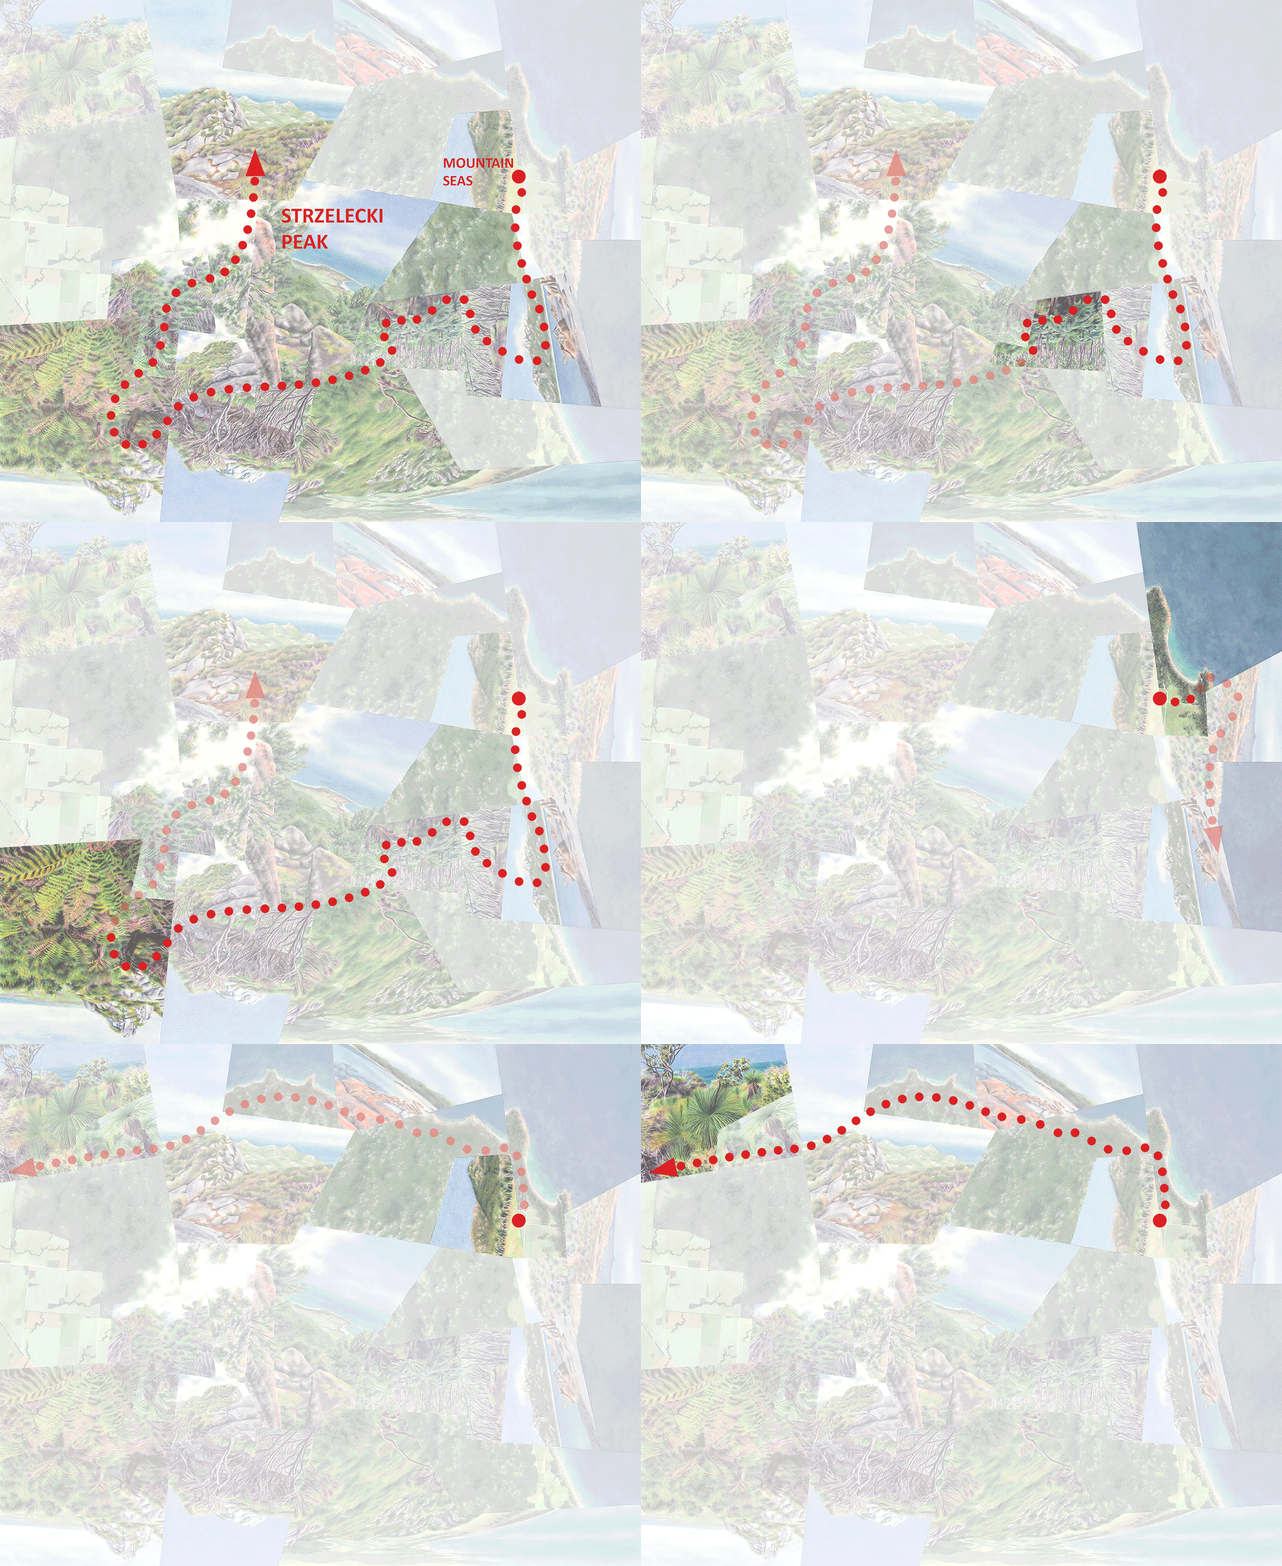
Location of Isla Incahuasi in the Salar, with the rough arrival and departure routes by car on my organized tourof course no actual roads are necessary!

Loop trail and perimeter walk on/around the island (dashed), and vehicular arrival and departure routes (solid).

The island’s small scale and steep topography guarantee that from any vantage point looking outward, the featureless white forms a prominent backdrop; the salt pan’s dramatic juxtaposition with the rugged cactus-y foreground is ever-present.

Austere and surreal landscape of giant cacti on Isla Incahuasi in the Salar de Uyuni, Bolivia, the world's largest salt pan.

Typical view from mid-elevation on the loop trail.

Austere and surreal landscape of giant cacti on Isla Incahuasi in the Salar de Uyuni, Bolivia.

Looking along the northeast peninsula from just below the summit.

Austere and surreal landscape of giant cacti on Isla Incahuasi in the Salar de Uyuni, Bolivia.

View inland toward the central ridgeline.

Cacti on Isla Incahuasi in the Salar de Uyuni, Bolivia, the world's largest salt pan.

Salt meets stone, with the Salar’s polygonal patterning that inspired the layout of the worldview.

From the island in most directions there are glimpses of the mountainous landscape beyond the Salar, but from certain spots along the drive the plain appears endless.

It’s this sense of contrast and isolation, of a tiny dot floating in a vast sea of white, that I immediately knew I wanted to capture and heighten on paper, with the idea that I’d make the work as big as possible (the full size of my stretching board) and use blank paper to suggest the salt from overhead. I also figured I’d extend the salt pan all the way to the horizon in all the views, leaving out the distant mountains.

I had in mind something even more abstract and minimal than most of my previous works, accentuating the place’s otherworldly, mirage-like feel by depicting space less literally that I usually do…even though that feel depends on spatial relationships (between island and salt pan) in the first place. I pictured striking that balance by using the fewest number of fragments that would still clearly indicate the presence of a physical island.

In my initial sketches though, the composition was too complex. As usually happens I had too many views I wanted to incorporate; plus, I got a bit carried away with my idea to use a compositional structure of many-sided polygons to recall the distinctive pattern of mini-ridges on the salt pan.

I decided to eliminate all the aerial views (other than a minimum number of blank “salt” fragments)—the volcano beyond the edge of the Salar (at the top of the composition) obviously worked against the isolation theme, plus removing them would have the added benefit of heightening the dreamlike atmosphere by making the cartographic aspect more purely conceptual. (In fact the final version points back toward the style of my oil paintings, which generally didn’t include aerial perspectives. As I’ve written I consider those to be maps too, but they tend to have a more ethereal quality than the watercolors.) But the design was still too busy, and I also wasn’t happy with the relative areas of the two main elements (island and salt). I needed to maintain the island’s sense of smallness and isolation, but it kept getting bigger as I wanted at the same time to immerse the viewer in the feeling of standing on it.

Many more iterations later I had something that resolved these issues, with a more linear, “strung out” configuration for the island that I think further plays up the abstraction. (It’s also, appropriately, a bit suggestive of a brine shrimp.)

Abstract watercolor painting of cactus-covered Isla Incahuasi in the Salar de Uyuni, Bolivia.

Crystallize, watercolor on paper, 52”x40.”

Crystallize overlaid with the routes of travel (the transparent segments run behind the landforms).

The title Crystallize references not just salt crystals but also the island’s mirage-like quality, seeming to materialize out of nothing and float in mid-air.

You can see that the route overlay doesn’t work out very well with the summit trail, since the reduced number of images means that a large segment isn’t covered (actually it’s “hidden” behind the view of the island’s central ridgeline). But it highlights the difference in approach between this map and my other, more straightforwardly map-like works.

Darren

Detail, top half of the island.

Detail, bottom half of the island.

Climate Journeys | Australian Rainforests

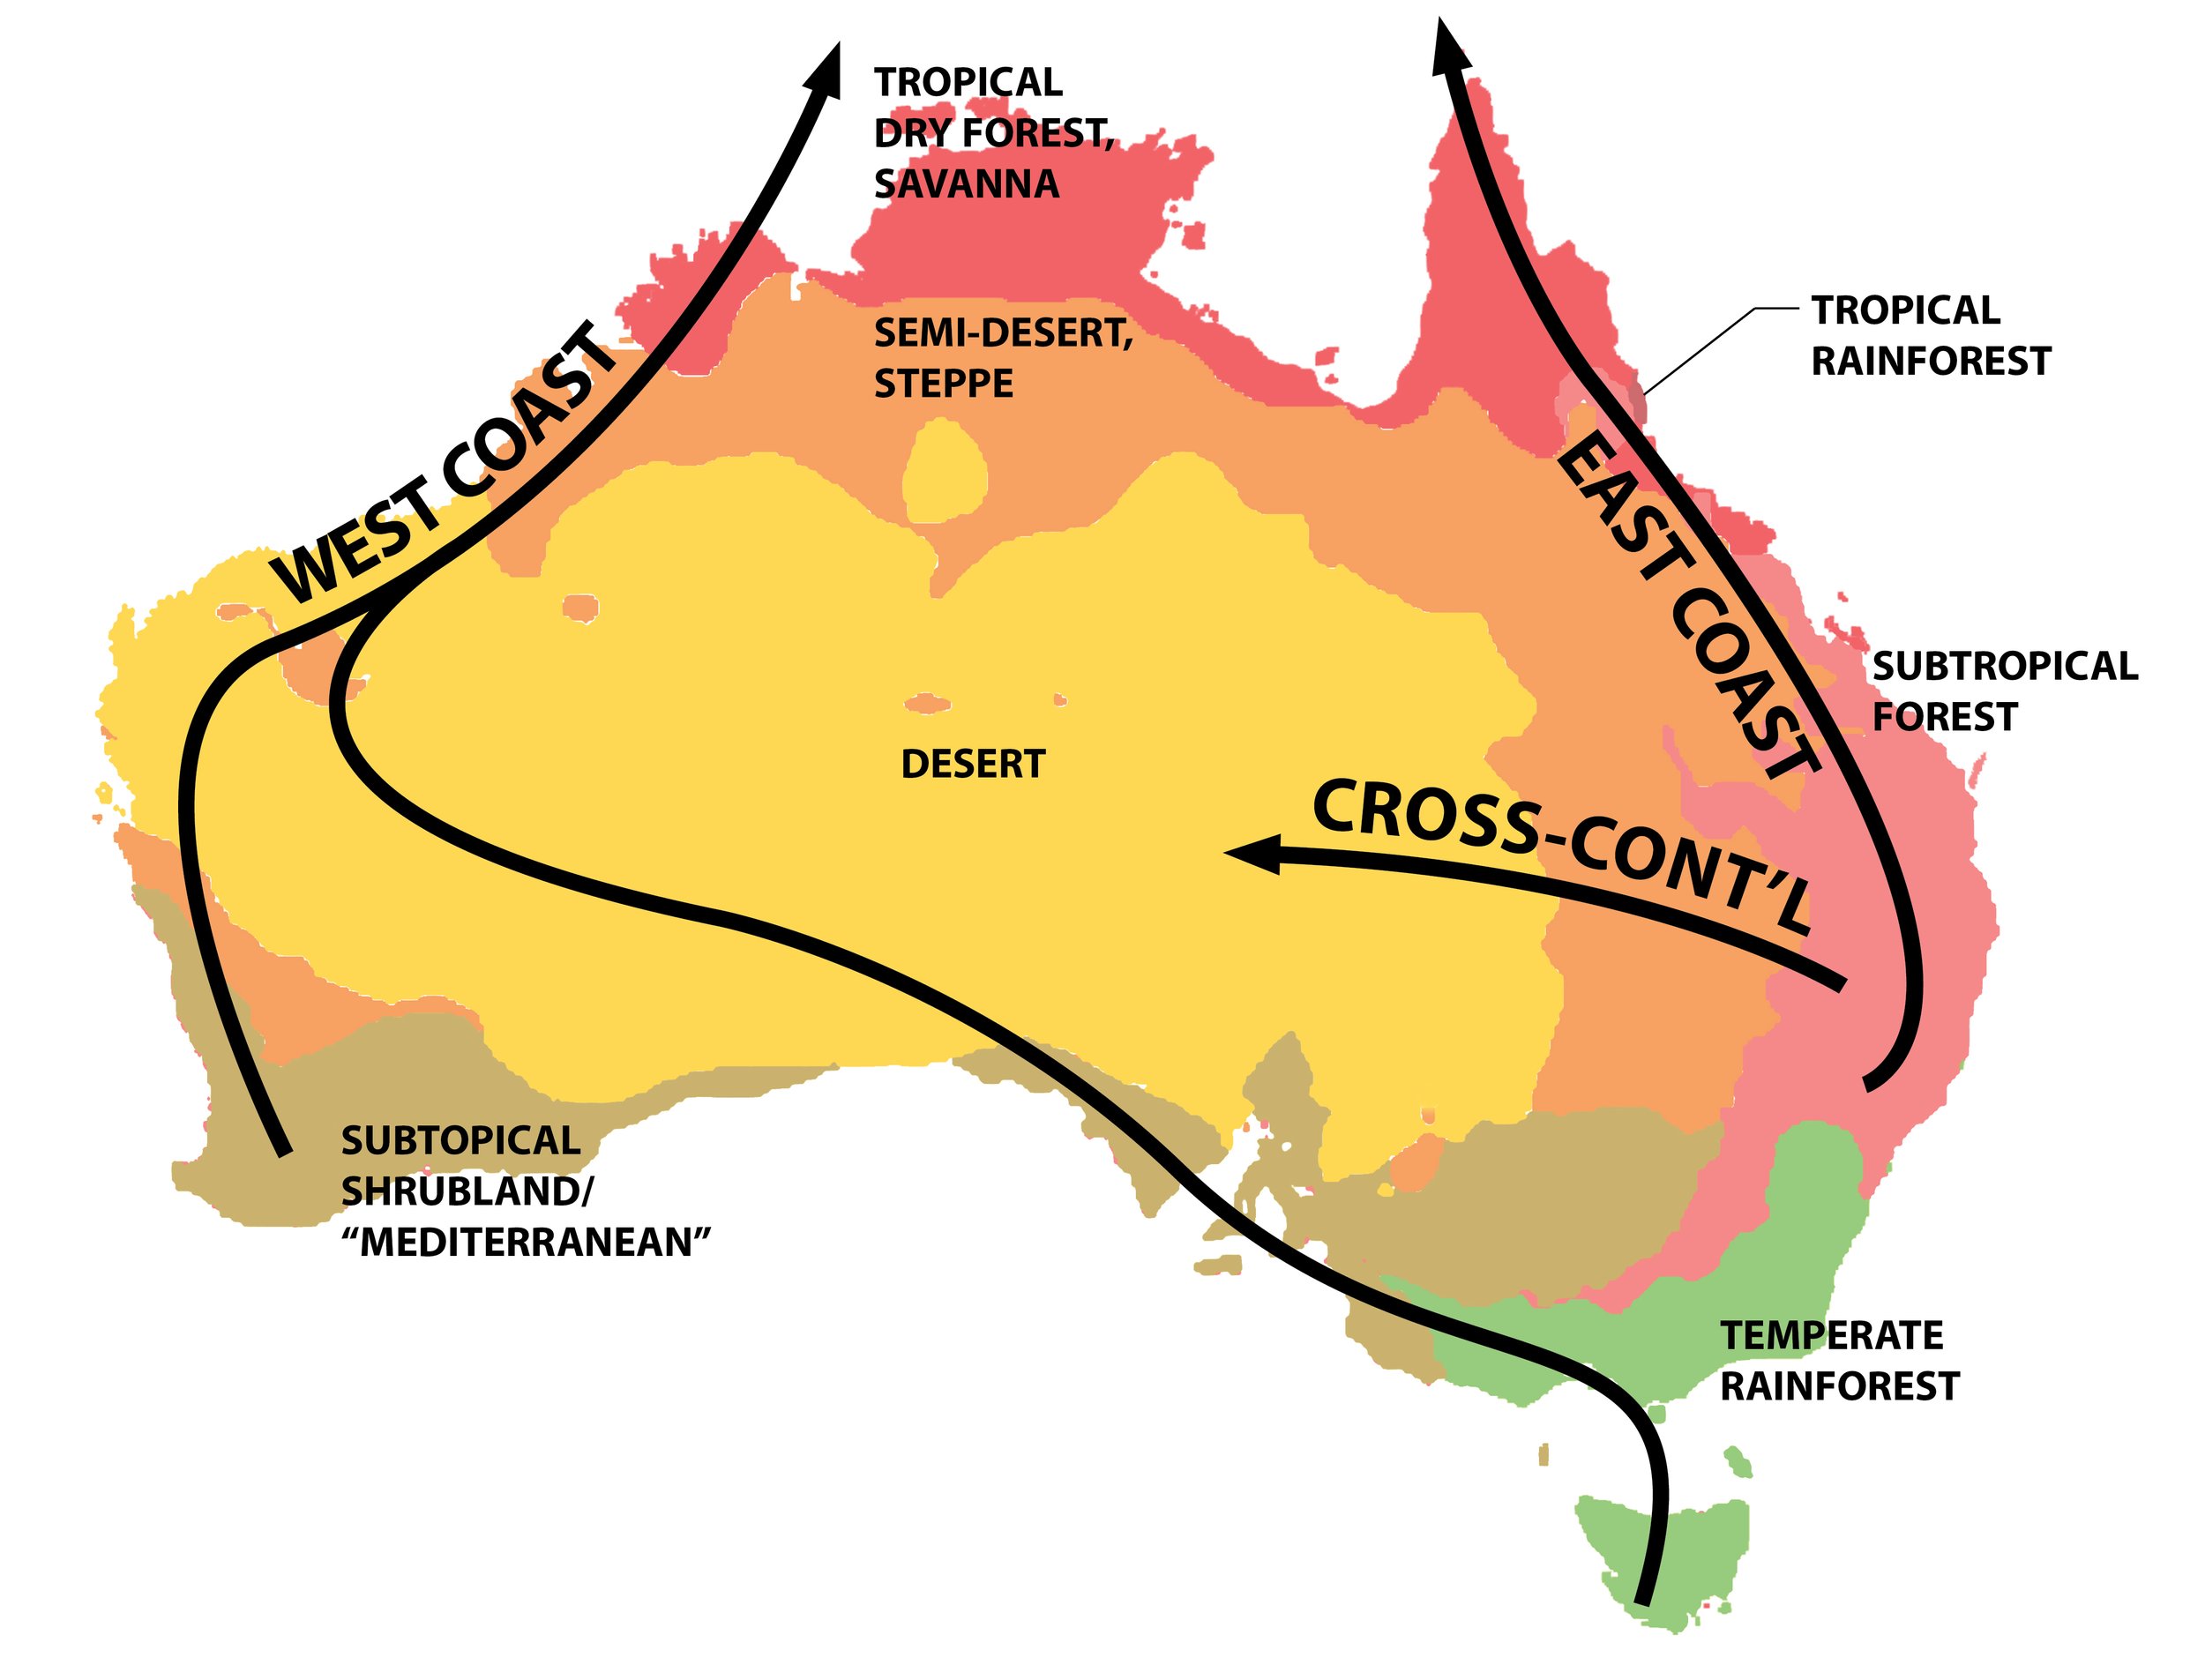
My previous posts in the “Climate Journeys” series have focused on three typical types of climatic pattern—”East Coast, “West Coast,” and “Cross-Continental”—that repeat across different continents. These last few entries will deal with exceptions to those patterns that I find interesting because of their divergence from those typical conditions. Today I’ll focus on eastern Australia, the only place in the world where temperate rainforest transitions to tropical rainforest. (The continent doesn’t extent far enough south to incorporate a subpolar rainforest ecoregion.)

Climatic patterns in Australia, with the temperate continental part of the typical “East Coast” pattern “replaced” by temperate rainforest usually associated with west coasts. Note that Australia’s (lowland) tropical rainforest ecoregion is tiny—found only around the Cairns region (so the coastal patterns couldn’t really be called complete without extending northward into Indonesia/Papua New Guinea).

Temperate rainforest zones, part of the “West Coast” pattern, are typically separated from their tropical counterparts by much drier climates and a few thousand miles or so (i.e. from the Pacific Northwest across the Sonoran desert to Central America, or from Patagonia across the Atacama to Ecuador/Colombia). And along east coasts, where those drier zones are typically absent, temperate rainforest climates are absent too (again this is broad-brush and topography-blind; a few pockets of temperate rainforest do exist in the Appalachians and some montane areas of Japan for example). But in eastern Australia, as I’ve shown before (and you can see more zoomed-in here), the Southern Ocean has the effect of wrapping the maritime-influenced “west coast” pattern around to the southeast corner of the continent, replacing what would be climates similar to the northeastern U.S. (i.e. cold-winter continental) if the landmass extended toward Antarctica.

So the shape of Australia places both temperate and tropical rainforest zones on the east coast, without intervening desert/semi-desert zones. A large region of subtropical forest and tropical dry forest/savanna, though, still sits in-between—not arid, but (analogous to most of Florida for example) not rainforest. This is where a unique aspect of Australian forest ecology comes in: rainforest habitats don’t necessarily align with the rainforest ecoregions. Relicts of a cooler, wetter period, when the continent was situated farther south, are a string of “islands” of rainforest vegetation extending all the way from the temperate to the tropical regions—across zones where localized environmental conditions allow it to thrive where rainfall alone isn’t sufficient. This includes the relatively dry intervening subtropical forest and tropical dry forest regions, but also the southeastern temperate “rainforest” zone where in fact rainfall isn’t uniformly high and isn’t the only factor influencing vegetation. (Again I’ve greatly generalized the ecoregion designations in order to highlight broad global patterns.)

Distribution of “actual” rainforest habitat, grading from temperate through subtropical to tropical. (It’s necessarily simplified at this scalethere are other, much smaller pockets interspersed with these, and the ones shown are certainly further fragmented.)

The environmental conditions determining the distribution of these rainforest islands interact in complex ways, but as described in-depth by D.M.J.S. Bowman in Australian Rainforests: Islands of Green in a Land of Fire, the most important of these conditions seems to be protection from fire—by topography and to some extent the self-perpetuating cool, shady rainforest environment itself. (Unfortunately those protections have proved to be less of a match for the increasingly intense wildfires of the past few years.)

You could argue that these islands don’t actually form a true “rainforest” gradient, since they exist somewhat independently of rainfall levels. But in terms of species composition, ecosystem structure, environmental conditions, and experiential quality they either have a lot in common with the high-rainfall regions at either end of the transition or, in the central portion, make up an intermediate subtropical rainforest zone. In fact in Australia the term rainforest is used to refer to a habitat/ecosystem, not just an ecoregion, and it’s purposefully written as one word in order to deemphasize rain as the determining factor (I typically write it as one word just out of habit).

My personal experience of rainforests along the gradient, on my first Australia trip in 2010, was a bit scattershot, but here are some representative images.

Lush tree fern gully in the temperate rainforest of Great Otway National Park in Victoria, Australia.

Temperate rainforest in a “fern gully,” Great Otway National Park, Victoria. These lush gullies are particularly good examples of rainforest-supporting microclimates.

Lush tree fern gully in the temperate rainforest of Great Otway National Park in Victoria, Australia.

Tree ferns in Great Otway, probably the most identifiable plants in the temperate rainforests.

Lush palm forest (with Archontophoenix alexandrae) at the base of Mt. Warning in Australia.

Subtropical rainforest at the base of Mt. Warning in northern New South Wales. Palms (absent in the temperate rainforests) are common at these latitudes, often forming extensive, pure stands.

Palms and tree ferns in subtropical rainforest on Mt. Warning, Australia.

Tree ferns occur in the subtropical rainforests but more so at higher elevations (here also at Mt. Warning). Trees with buttressed roots (left, in the background) also start appearing in the subtropics.

Lush subtropical rainforest on Mt. Warning, Australia.

Tropical rainforest near Cairns, Queensland—the diversity in species and life forms is noticeably higher than farther south.

Lush subtropical rainforest on Mt. Warning, Australia.

More tropical rainforest near Cairns (Daintree National Park).

 
Colorful cassowary in tropical rainforest of Daintree National Park, Australia

Of course the fauna changes too with latitude. As you know I tend to pay relatively attention to it, but I learned after-the-fact that standing this close to a cassowary was a really, really bad ideanote the claws (Daintree National Park).


A fairly significant percentage of this rainforest archipelago is protected in national parks, but the warming and drying climate will have significant effects—fire-related and more—on the health of individual forest islands as well as on the overall pattern of species distributions and ecological character. Even while it remains intact, though, the temperate-to-tropical transition is challenging to take in over such long distances in the real world, not to mention from a few selected photos like these. It might be another “long gradient” that could lend itself well to my photographic transect idea.

Darren

Approach

Abstract watercolor painting of snowcapped Villarrica Volcano in Chile, with steaming crater.

Approach, watercolor on paper, 44”x38.”

Since we’ve been in Chile for the last few posts, today I’ll lead you through another worldview inspired by my 2019 trip there. This one is based on Villarrica Volcano in the Lake District, a region of the country well-known for its scenic lakes, forests, and mountains. The work, and the place, combine two of my favorite themes—ecological edges/gradients and accessible volcanoes.

On the ecological theme, Villarrica is located in the country’s temperate rainforest region—though at the northern edge of it, and the forests felt dry in comparison to those of Patagonia and Chiloé Island farther south. They’re made up mostly of Nothofagus or “southern beech” species (a genus also common in the rainforests of New Zealand), reaching towering heights in the lower zones but becoming shrubby and contorted approaching the mountain. Since the elevation gain is relatively modest, the change in character is probably as much the result of rockier substrate as of cooler temperatures.

The bottom part of the watercolor, moving roughly from lower-right to center-left, captures that character change along a several-hour hike at the base of the volcano; it ends at one of many “parasitic craters” (tiny cones around the perimeter) where the forest starts to give way to lava fields. The braided channels in the aerial fragments were formed by mud flows during past eruptions.

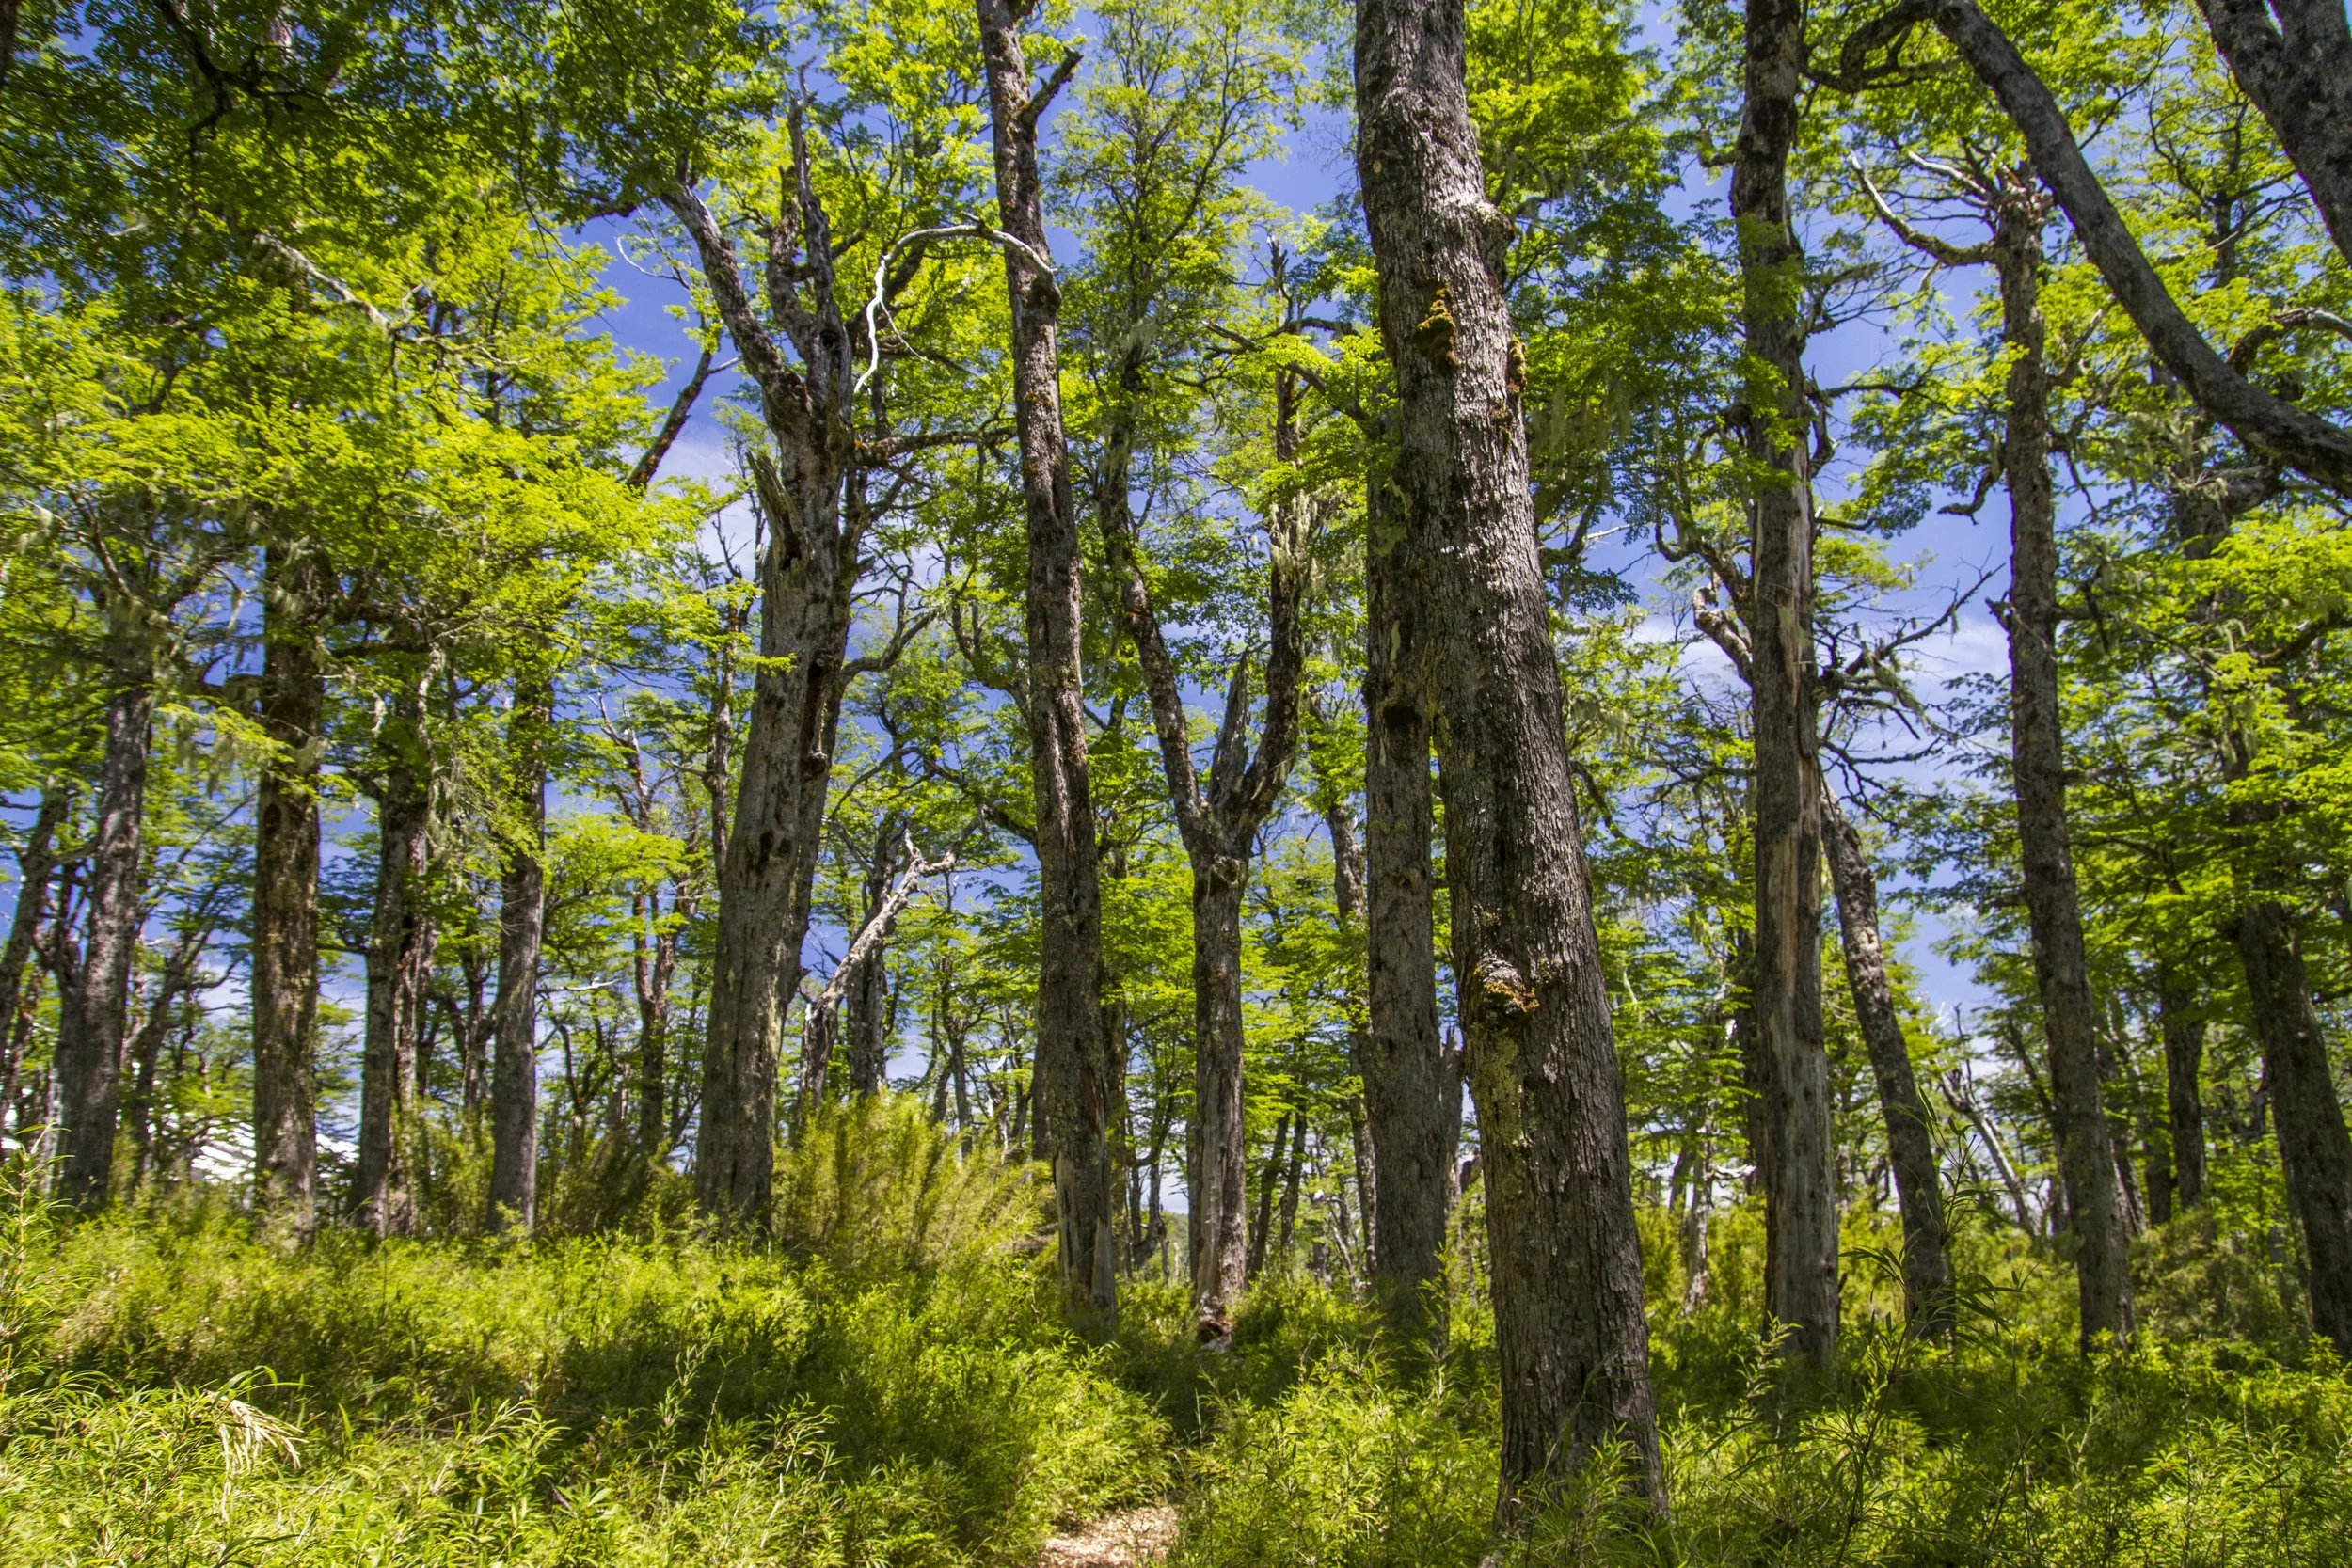
Lush Antarctic beech forest near Villarrica Volcano in The Lakes region of Chile.

Tall low-elevation beech forest with patches of bamboo in the understory—you can glimpse the volcano in the distance.

Antarctic beech forest near Villarrica Volcano in The Lakes region of Chile.

Approaching the volcano and climbing a bit, the forest becomes shorter and bushier…

Stunted Antarctic beech forest with view of mountains beyond, near Villarrica Volcano in The Lakes region of Chile.

…and increasingly wind-blown.

Parasitic crater at the base of snowcapped Villarrica Volcano in The Lakes region of Chile.

A parasitic crater at the end of the trail, with the mountain beyond. I’d actually climbed the volcano the day before this hike—probably good timing, since as you can see the summit is smoking quite a bit (and was probably closed that day).

The rest of Approach captures the half-day climb to the volcano’s summit, which begins from a separate spot at the base of the mountain—or technically on the mountain slope, since a chair lift allows you to bypass the lower part. It can only be done as part of an organized climb, and while I’d still classify it as a hike, it does require crampons, ice axes, and other gear.

Snowy slopes of Villarrica Volcano in The Lakes region of Chile.

Climbing Villarrica, with the summit rising up ahead in the center.

In hard hat and gas mask at the steaming crater of Villarrica Volcano in The Lakes region of Chile.

Yes, that’s me.

The volcano is still active—last major eruption was in 2015—and gas masks are needed at the crater rim because of the sulfur dioxide. I thought I could pull mine down briefly to take a photo, and I’ll say it isn’t fun to take a breath expecting oxygen but getting something else.

Steaming crater at the snowcapped summit of Villarrica Volcano in The Lakes region of Chile.

Villarrica is quite different from the tiny, quiet, “domesticated” volcanic cones that I’m typically inspired to capture—and compress even further—on paper. But being able to peer into the giant, active crater at all, and to ascend and descend the mountain in just a few hours (thanks partly to the chair lift and being able to sled/slide all the way down) did seem to shrink it just a little, giving me some of that feeling of empowerment that draws me to usually much tamer volcanoes. Those mini-volcanoes can no longer hurt you, but climbing this one is like “conquering” any daunting or potentially dangerous physical feature—the whole point is that you might not have succeeded.

The title Approach comes from the work’s illustration of two distinct journeys that are each in a sense cut short. The forest hike approaches the foot of the mountain but doesn’t climb it or even quite reach the snow line, and so on paper I was forced to knit together the forest and mountain components with aerial and distant views. And while I find the experience of standing at the bottom of a crater to be particularly exhilarating when it’s possible, the Villarrica summit hike reaches the edge of the crater but for obvious reasons doesn’t enter it. (Our time at the edge was itself brief and a bit harrowing, with the gas and the cold.) I think in general the title reflects the fact that this work, unlike most of my others, conveys my sense of feeling small—verging on overpowered—rather than capturing the unexpected “smallness” of a landform or environment we typically perceive as unbounded or overpowering.

Darren
Detail, forest hike.

Detail, summit hike.

Oasis

I’m not quite done with my “Climate Journeys” series. But building on my last post overlaying one of those “long,” mostly latitude-dependent journeys—along the west coast of South America—with one type of “short,” topography-generated gradient—from dry to fog-induced wet—today I’ll take a break from the long gradient theme by diving into one particular “fog-scape” example.

Abstract watercolor painting inspired by the foggy desert oasis of Bosque Fray Jorge in Chile.

Oasis, watercolor on paper, 38”x38”.

Oasis was inspired by Bosque Fray Jorge National Park, featuring patches of evergreen forest surrounded by cactus-filled semi-desert. It’s located a few hours south of La Serena, Chile, near the southern end of the sequence of fog-scapes that I laid out last time in the diagram below.

The park was possibly the highlight of my six-week 2019 trip to Peru, Chile, and Bolivia, though I nearly didn’t make it there because it turned out to be closed on the day I’d originally planned to go. I ended up making a special trip back there, driving five hours each way from Santiago for the only “hike” available in the park, a 1km boardwalk between those forest islands. The walk itself wasn’t the only attraction—the drive from the dry lowlands up into the foggy hills was just as interesting—but it gives you a sense of how badly I wanted to see this place.

Sequence of “fog-scapes” along the overall rainfall gradient from central Ecuador to central Chile (more detail here).

Bosque Fray Jorge and environs, with the dry lowlands on the left and right sides and the spine of green hills in the center (image from Google Maps).

As I’ve mentioned, the typical arid landscape of the region is structurally similar to the Sonoran Desert, with scattered low shrubs mixed with stands of tall cacti.

Cacti in the desert surrounding the foggy hills of Bosque Fray Jorge in Chile.

Arid landscape along the approach road to Fray Jorge. Unfortunately there’s no walking route linking these lowlands to the oasis in the hills.

Cacti in the desert surrounding the foggy hills of Bosque Fray Jorge in Chile.

Climbing into the hills, the cacti thin out and bromeliads start to appear. Bromeliads (including pineapples and Spanish “moss”) are typically thought of as wet-climate plants, but the species in Fray Jorge (Puya chilensis) is one of several common in upland zones of Chile’s dry regions.

Bromeliads (foreground) intermingle with cacti in the lower part of the hills.

Islands of forest in the upper zone of the hills.

Soon the cacti disappear (apart from a few stragglers here and there), the composition of shrubs changes to more moisture-dependent species, and the bromeliads proliferate to form dense carpets. As the topography levels out near the top of the range, trees appear in scattered clumps.

This was early December; while as you can see in my photos there’s still plenty of fog, it’s less persistent than during the southern-hemisphere winter. So although the trees keep their leaves, the shrub layer is largely dried out, and the bromeliads have finished flowering.

Puya chilensis bromeliads overlooking the desert in Bosque Fray Jorge in Chile.

An area of bromeliads, having flowered earlier in the year, with the dry lowlands in the distance.

Fragment of forest in the desert oasis of Bosque Fray Jorge in Chile.

A small clump of forest, patches of shrubs still in leaf, and an errant cactus.

The road ends, and the boardwalk loop begins, on the edge of a zone where the forest fragments multiply and coalesce into larger patches.

Moving clockwise around the loop, the boardwalk passes through an open area of shrubs and bromeliads, in and out of a few forest patches, and then out into another open area (with a viewing platform) overlooking the dry coastline on the other side of the hills. (I really wish there were a walking route from there all the way down to the coast. There is another, longer trail that was closed at the time; it doesn’t appear on any map, but I should’ve asked about it since I wonder if it goes in that direction.)

Boardwalk through the lush oasis of Bosque Fray Jorge in Chile, overlooking the desert coastline.

The boardwalk then heads back inland, and snakes through an island of forest large and dense enough to screen out the surrounding landscape (before re-emerging back at the road). As I mentioned last time, probably because of the season the forest didn’t have a drippy-wet feeling that would’ve made it feel even more evocative; but, it is referred to as a disjunct piece of southern Chile’s Valdivian rainforest and the main tree species is indeed common in those temperate rainforests. In any case it is incredible that fog by itself is capable of creating such a dramatic contrast.

Boardwalk through the lush forest oasis of Bosque Fray Jorge in Chile.

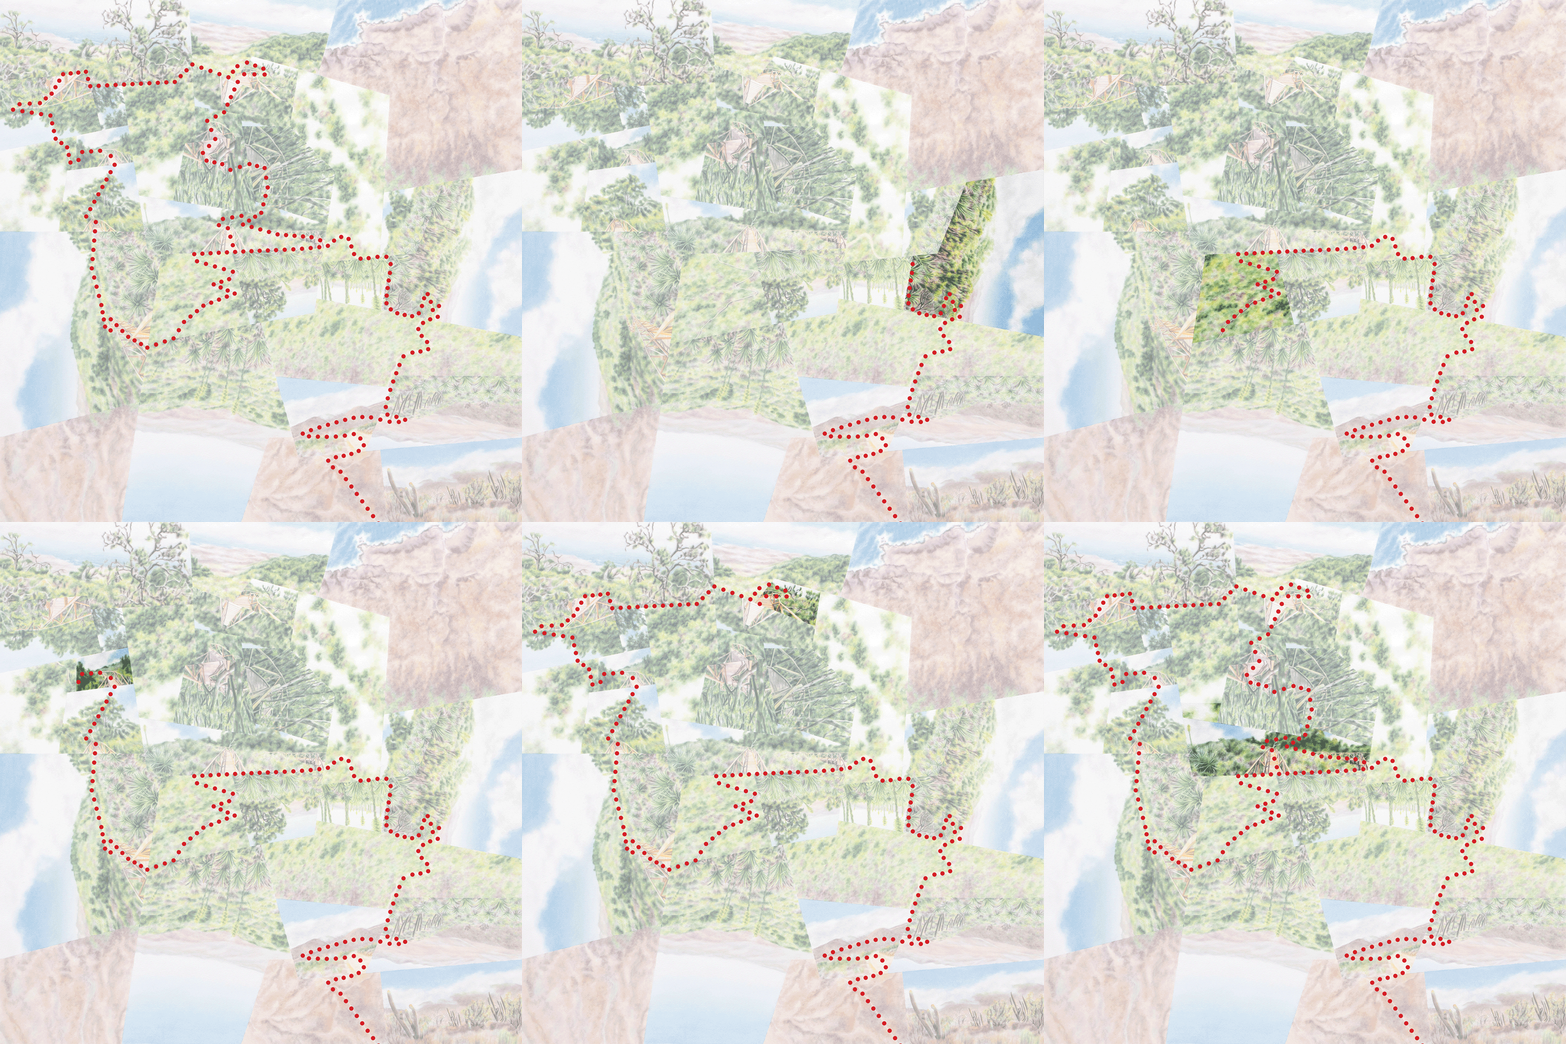
In these pencil sketches/overlays, I worked on shaping the fragments to capture the motion of stepping upward into the hills (from the lower right corner) and then spiraling inward into the forest (top-center).

Capturing and heightening this experience on paper involved a few unique challenges. In terms of composition, it took a fair amount of tinkering to find the right balance of semi-desert, shrubby transition zone, and forest to depict a smooth brown-to-green gradient but also enough of the two extremes to sufficiently emphasize 1) the overall contrast and 2) the centrality of the forest islands (despite their relatively tiny areas) to the experience of the place. Conveying that centrality meant zooming and zeroing in more and more closely (i.e. increasing scale) as the journey progressed, plus shaping and arranging the fragments to create a sense of spiraling inward toward the forest and then coming to rest. So “centrality” incorporates aspects of arrival and stasis as well as (compared to the expansiveness of the landscapes beyond) enclosure and containment.

My abstracted path of travel from dry lowlands to wet highlands, along road and boardwalk.

 
Detail of abstract watercolor painting inspired by Bosque Fray Jorge in Chile.

Detail, semi-desert zone.

Detail of abstract watercolor painting inspired by Bosque Fray Jorge in Chile.

Detail, transitional zone.

Detail of abstract watercolor painting inspired by Bosque Fray Jorge in Chile.

Detail, forest zone.

Another challenge came during the painting stage (which is never the most interesting part for me, but I can’t pretend it doesn’t take a great deal of thought), when I wanted to chromatically intensify the dry-wet contrast. As you can tell I depict the oasis overall as much more luxuriant than in my photographs (again, taken during the “dry” season) and in the satellite imagery. That might sound like just a matter of adding more green paint, but there are many possible greens, and choosing/combining them is a bigger challenge when I’m trying to create some imagined condition that also unifies the aerial and ground-level views.

As you’ve heard me say before with other fog-scapes, I’d really like to re-visit this one during the “right” time of year. I’m not sure it would necessarily result in a better worldview—the artificial greening might turn out to be more evocative than a representation of the real thing—but it would make for an even more surreal real-world experience.

Darren

Climate Journeys | Fog-scapes

In my last post I took a brief detour from the “long” dry-to-wet gradient along the Ecuadorian coast to mention the fog forest of Machalilla National Park—by all appearances a “rain”-forest in the middle of that latitude’s typical semi-desert/dry forest ecosystem. The cold ocean current that’s largely responsible for Pacific South America’s unusually extensive arid zone also produces persistent fog in those same arid regions for about half the year. From central Ecuador to central Chile, wherever the topography has the right height and orientation to capture it, the fog supports comparatively lush islands of green.

Just like the drier landscapes surrounding them, these “fog-scapes” take different forms depending on their latitude. That’s partly due to topographical differences and local variations in fog conditions, but since “actual” rainfall (i.e. not fog) falls on both the highlands and the lowlands, you could say that this fog-scape pattern is generated by two scales of precipitation gradients overlaid on one another—the “long” north-south rainfall gradient and the “short” topography-generated fog gradients. (Note that in this Climate Journeys series I’ve been using “rainfall” and “precipitation” interchangeably, though in this post the former is more appropriate since “precipitation” includes fog drip.)

Four types of fog-scapes along the overall north-south climatic gradient. The dashed arrows on the right give a very rough approximation of where, in terms of precipitation, each fog-scape would fall along the overall (~sea level) gradient.

I’ve written about a few of these environments previously—this post will summarize and situate them within the larger-scale rainfall gradient and introduce a few others. (Because of topographical variation they don’t quite form a continuous chain down the coast, but many more than these exist.) I probably don’t need to say again that I find these environments thrilling, and am surprised they aren’t more well-known.

“Fog Forests”

The fog-scapes at the northern end of the rainfall gradient, inland from the coast of central Ecuador between 400 and 800m of elevation, once again are true forests, taller and more luxuriant than the surrounding dry forests. They’re like the cloud forests we typically think of but unlike, say, rainy Monteverde in Costa Rica, they wouldn’t exist at all without the fog (called garúa in Ecuador and Peru). The effect of the fog is self-reinforcing in that the trees themselves intercept a great deal of it, which then slowly drips to the forest floor.

While they’re about 900km from the mainland and I haven’t seen the relationship made explicitly, you might say that the wet highland forests of the Galápagos Islands also fit into this fog forest category (or at least the tiny fragments that still exist). The Humboldt/Peru Current flows past the islands as it heads westward away from the continent, essentially drawing them into the mainland rainfall gradient. The arid lowlands of the archipelago could generally be considered part of the same semi-desert/dry forest zone as the central coast of Ecuador; the primarily garúa-dependent highland forests (beginning as low as 300m above sea level) would be the fog forest equivalent. Like all Galápagos environments though, these forests are very distinctive, with low stature and species diversity; they’re formed exclusively by trees in the endemic genus Scalesia. (For a lot more detail on Galápagos vegetation zones, including the surreal too-wet-for-trees zone above the forest, check out my post on Santa Cruz Island.)

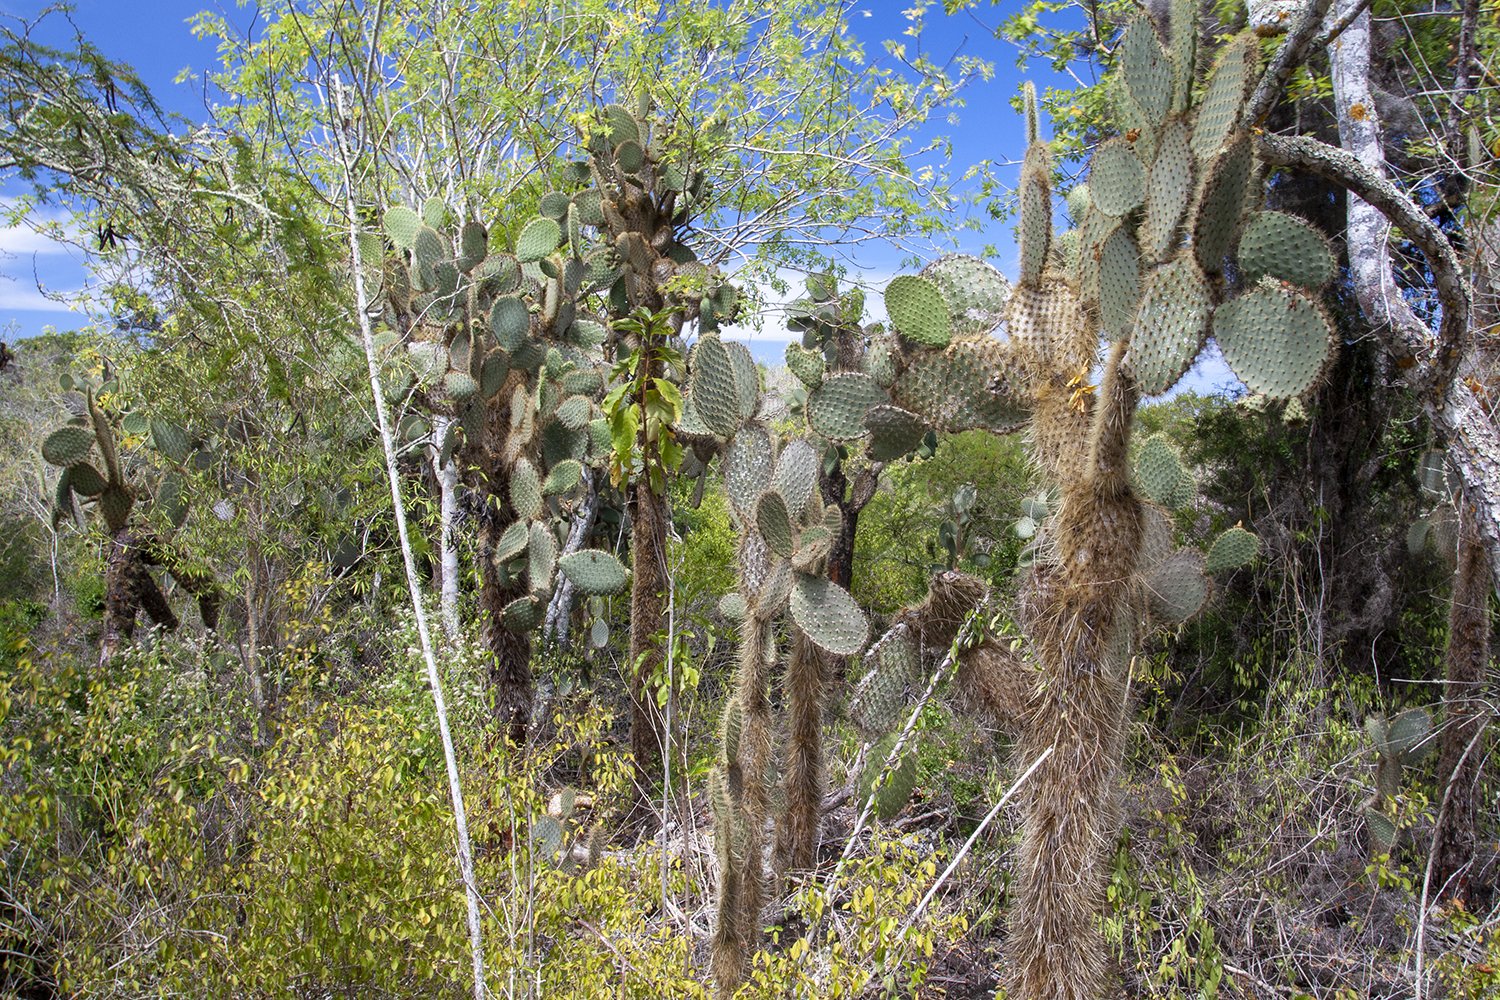
Opuntia cacti in dry forest on Santa Cruz Island in the Galapagos

Lowland dry forest/semi-desert on Santa Cruz Island in the Galápagos....

Scalesia forest in the highlands of Santa Cruz Island in the Galapagos

…and Scalesia forest in the highlands.

“Fog Oases”—Peru

Along the coasts of Peru and northern Chile where rainfall drops to just an inch or two a year, the fog-scapes are called “fog oases,” “fog meadows,” or lomas (“small hills”). The near-absence of rainfall means that these landscapes are much more sparsely vegetated than their counterparts in Ecuador. The Lomas de Lachay a few hours north of Lima (inspiration for Fog Meadows) resembles a meadow or savanna, with only scattered trees even in the wettest parts. There is a continuous carpet of herbs and grasses, shockingly green (and specked with wildflowers) during the winter compared to the complete desolation beyond, but all of that turns brown during the fog-less season.

My photo of somebody else’s photo of the Lomas de Lachay at the height of the fog season, overlooking the desert below. You can find a bunch of my own images here.

Lush fog oasis overlooking the desert in the Lomas de Lucumo in Lima, Peru.

Another “fog meadow,” the Lomas de Lucumo, this one right in the city of Lima. This one’ll also make it into watercolor at some point.

“Fog Oases”—Chile

In Chile these environments tend to have a very different character, without the trees or green carpet. The difference is probably explained by less persistent fogs (in Chile called camanchacas) compared to Peru (according to The Phytogeography and Ecology of the Coastal Atacama and Peruvian Deserts, a great description for anyone who wants to get into the weeds on this). The plants—most notably cacti but also bromeliads and woody shrubs at the higher elevations—are more clumped or scattered, somewhat like the wetter semi-desert areas to the south and in the Andean foothills to the east. Pan de Azúcar National Park, in the southern Atacama, is one of the best examples in terms of species diversity although (as with all of these fog-scapes) I didn’t catch it at the best time of year.

Cacti in the Atacama Desert in Pan de Azucar National Park, Chile.

The uplands of Pan de Azúcar, more lifelike during the foggy season.

Cactus covered with lichen in Pan de Azucar National Park in the Atacama Desert in Chile.

The cacti are draped with lichen—here dried out—at higher elevations.

“Valdivian Rainforest”

Continuing south to about 400km north of Santiago, rainfall increases again and the typical landscape transitions to cactus-filled semi-desert, though by North American standards it’s still quite desert-like (resembling the Sonoran to a degree). Again topography and local fog patterns probably play a role, but I’d expect that the higher rainfall has a lot to do with why the fog-scapes in this region, all found as far as I know in the hills of Bosque Fray Jorge National Park, do contain pockets of actual forest in the highest parts (~400-500m). They’re dense and evergreen, with plenty of moss and lichen, but I wouldn’t call them rainforest-like even though they’re considered to be disjunct islands of “Valdivian rainforest”—the name given to the Chile’s temperate rainforest zone to the south. (Incidentally the subpolar rainforests beyond that are called “Magellanic.”) That does suggest some true affinity, plus the forest probably would’ve felt more luxuriant during the fog season. But that classification could also be a less formal one based on species affinity rather than strong ecological or climatic similarity—the predominant tree species in Fray Jorge is common (in much more massive form) in the temperate rainforests.

Lush fog oasis overlooking the desert coastline in Bosque Fray Jorge in Chile.

A few of the arid coastline from the highlands of Bosque Fray Jorge. The patches of forest (like in the middle-ground) are interspersed with zones of shrubs and bromeliads (foreground).

(There’s a lot more to say about Fray Jorge, and as I shared in my last Newsletter I’ve recently completed a worldview that it inspired—that’ll be my next post!)

“Hygrophilous Forest”

This one I actually haven’t been able to visit, but it rounds out the discussion well since as far as I can tell it represents the continent’s southernmost fog-scapes, around the latitude of Santiago where the influence of the coastal fog belt peters out.

Moving south into the subtropical shrubland (Mediterranean) zone, the fog supports “hygrophilous” forests (the term, which I hadn’t come across before, means “damp”). Like Fray Jorge’s forest pockets these forests are evergreen and have close affinities with the temperate rainforests to the south, though in this case I haven’t seen them referred to as “rainforests” themselves. Unfortunately I can’t speak to their atmosphere in that regard, from experience or from photographs (of which I haven’t found any). According to the only description I’ve seen of these forests, the best examples are found in west-facing valleys in La Campana National Park, about 50km to the northwest of Santiago and from the coast. I did spend a few days there but didn’t know at the time that these forests existed. They do receive more rainfall than Fray Jorge and have an abundance of lichens and epiphytes including Spanish moss (actually species a bromeliad), so my guess is that they do have a more rainforest-y aspect. Whether they could give my diagram a nice symmetry as the temperate equivalent, precipitation- and character-wise, of Ecuador’s fog forests would be interesting to know.

Another comparison might be to the SF Bay Area’s redwood forests, which are also highly dependent on fog and are located in another subtropical shrubland/Mediterranean zone (though with slightly higher rainfall…Santiago is at the equivalent latitude of Los Angeles). These I’ve also seen classified as “rainforests” by some and not others, depending on whether “rain” is taken to mean “precipitation” in general.

Given that I only had the chance to visit a small number of these fog-scapes, and not at the ideal time of year, I’d really like to put together some sort of creative project to explore/portray them as a unit—which I haven’t seen done before, even just in text—and at their most evocative. I think it would make both a more feasible and a more interesting proposal than, say, my long gradient transect idea. Plus, though I haven’t seen detailed predictions, I think it’s pretty certain that (with the context of their dry surroundings) these ecological gradients/contrasts are going to be easily and heavily affected by climate change, given the fog-scapes’ tiny scales and the finely-tuned climatic meteorological generating the region’s fog patterns.

Darren

Climate Journeys | Ecuador

My last post focused on the southern part of the world’s most dramatic “West Coast” climate journey—the Pacific coast of South America, where the extreme dryness of the coastal desert heightens the dry-wet contrasts to both the north and south. This time I’ll move to the northern side of the desert, where the transition from lowest to highest rainfall levels (traveling toward the equator) is even more dramatic because it’s compressed into a much shorter distance—roughly 1200km/800mi. This creates the world’s sharpest rainfall gradient at sea level, which I’ve long assumed to be the case but thanks to my go-to reference The Earth’s Problem Climates (Glenn Trewartha) I now know I’ve been right.

As I wrote last time that compression is the result of the desert’s more-northerly-than-usual extension compared to analogous desert belts on the other continents, thanks to a complex combination of factors but in particular the position of the cold Humboldt/Peru Current. The northern part of South America bulges westward into the Pacific, forcing the current out to sea in northern Peru. Then as the coastline curves back to the east starting at the Peru-Ecuador border, it’s as if rainfall levels are trying to return as fast as possible to what they would’ve been if the desert had given way at the more typical latitude (around 20 degrees, much farther south at the Peru-Chile border).

Vegetation and rainfall along the coastal “bulge” from northern Peru to southern Colombia. (Vegetation map adapted from Trewartha; rainfall map adapted from various sources.)

Technically the two ends of that roughly 1200km distance—Lobitos, Peru, with about 50mm/2in of rainfall and Buenaventura, Colombia, in the vicinity of the world’s wettest sea level location with about 5000mm/200in—aren’t even the true extremes. A few hundred km farther north, Lloró, Colombia is the second-wettest place anywhere on earth, receiving about 13,000mm/500in. And the actual minimum of essentially zero rainfall is in northern Chile. But at those extremes the additional increase and decrease are, vegetation-wise, relatively imperceptible. (Coastal Colombia’s record precipitation levels have been less well explained than the Peruvian/Chilean desert’s record dryness, but given that the two are located so close together, according to Trewartha it would make sense if a single phenomenon is responsible for both—probably the cold current).

My own experience of this gradient is a lot less complete than the Chilean one despite the shorter distance. That’s mostly for practical reasons—on the northern end, the coast of northern Ecuador/Southern Colombia isn’t considered very safe and the Colombia side is mostly wild and roadless. To the south, the pattern is interrupted/obscured by the Gulf of Guayaquil and the Guayaquil metropolis. Given those limitations and my assumption that renting a car would’ve been less advisable than in Chile (though I never actually looked into it), I didn’t set out to capture it in any systematic way. But in 2018, tacked onto a few weeks in the Galápagos, I did get a driver to take me the 300km from Guayaquil north to Manta, mostly along the famous “Spondylus Route” connecting popular scenic and cultural attractions along the coast. That did allow for more flexibility than a bus would have, but I decided to keep things simple and limit my immersive experiences to some low-key hiking in one national park.

I was, though, also looking forward to the views from the car window. As you might’ve noticed on the maps above, particularly the vegetation map, a significant piece of the gradient is actually squeezed in between Guayaquil and the coast. That’s because rainfall also increases dramatically from the coast heading inland: the influence of the cold current rapidly decreases moving eastward just as it does northward. But that piece of the drive turned out to be underwhelming. I think this was because most of the vegetation was in leaf (the rainy season was supposed to have ended by then but it didn’t look like it), blurring the wet-dry distinction, and the gloomy weather probably made it even harder to see. The fact that there isn’t much natural vegetation left didn’t help either. Also, according to Trewartha the coastal vegetation in that region is more lush that might be expected from the low rainfall because of the fog drip and overcast skies, though I’m not sure why those factors wouldn’t have the same effect in the “real” deserts to the south. And his own maps do show desert creeping up the coastline. So, it’s still a mystery to me.

The national park I visited is Machalilla, which includes one of Ecuador’s few intact remnants of coastal dry forest.

Dry forest behind the beach in Machalilla National Park on the coast of Ecuador.

Dry forest in Machalilla National Park, looking inland from the beach. (Despite the bad lighting you can see some bluish cacti poking through the canopy.) Later in the year it would be less green, but still not the desert the map would suggest.

Dry forest in Machalilla National Park on the coast of Ecuador.

Inside the dry forest. (It’s reminiscent of much of the arid zone of the Galápagos Islands, about 900km to the west.)

Cacti in the dry forest of Machalilla National Park on the coast of Ecuador.

Large forest cacti.

In another zone of the park, a little bit inland and rising a few hundred meters to intercept the fog layer, the fog does have a clear effect on the vegetation. Being a function of elevation this fog forest isn’t technically part of the “long gradient” I’ve been focusing on, but it’s worth pointing out how the fascinating fog-generated landscapes of this region (a result of the same cold current) take different forms along that latitudinal gradient. Since it’s supported by fog “overlaid” on dry forest rather than on desert, the fog forest is basically indistinguishable from a rainforest—unlike the savanna-esque fog meadows in Peru that are dessicated for most of the year. (Unfortunately as far as I know it isn’t possible to hike between these two sections of the park, so this particular contrast isn’t worldview material.)

Lush fog forest in Machalilla National Park on the coast of Ecuador.

Fog forest (second-growth) in Machalilla.

Dropping below the fog again, north of Machalilla the forest gets perceptibly taller and the large cacti disappear. In certain areas these Ceiba or “ceibo” trees (C. trichistandra) are the most notable feature—they look a lot like green baobabs!

Green-trunked ceibo trees, or Ceiba trichistandra, in dry forest near the coast of Ecuador.

A few ceibos in (heavily disturbed) forest right along the road.

The author with a green-trunked ceibo trees, or Ceiba trichistandra, in dry forest near the coast of Ecuador.

And from Manta, just a bit north of there, I flew to Quito—shifting my attention to mountains. I really wish I’d been able to continue north along the coast; if that ever becomes feasible it could be worth trying to drive (i.e. be driven) all the way from northern Peru to as far north as the road goes, during the dry season. Finding a representative string of accessible semi-intact natural areas won’t be easy. But, the hyper-compressed aspect of the gradient would make it a particularly good one for applying the transect ideas I’ve been thinking about (or ones I haven’t yet thought about) in a systematic way, even if the focus is mostly on human-dominated landscapes and how they reflect/impact the gradient.

Darren

Climate Journeys | Chile

This post and the next will take a closer look at one of the “West Coast” climate journeys I mapped in the last post—along the Pacific coast of South America. I’m choosing this one because 1) it incorporates the full range of climates/biomes without large intervening bodies of water, 2) it’s one of the world’s most dramatic in terms of its contrasts, and 3) I’ve been able to travel, relatively continuously, a large part of it during a period when this topic was at the front of my mind.

Before I get into this example I’ll mention why I’m not focusing on any North American ones, which #1 (mostly) applies to and which are relatively straightforward to travel. The reason is that despite their accessibility #3 doesn’t apply. I have visited many places along both coasts but generally piecemeal, with the exception of a high school family road trip from L.A. to Vancouver when I wasn’t yet obsessed enough with this subject to coax everyone into a string of representative hikes along the drive. And the 2020 coast-to-coast drive I wrote about last year hardly involved leaving the car let alone visiting any quasi-natural areas (which are few-and-far-between in the middle part of the U.S.).

The progression of climates and biomes along the west coast of South America is the most dramatic in the world thanks especially to the extreme dryness of the Atacama and Peruvian deserts—in the driest part, around Antofagasta in northern Chile, it basically doesn’t rain—and their latitudinal extent. Both of those aspects result from overlapping conditions that would each likely produce a desert on its own.

Pacific South Americaclimates/biomes (left) and precipitation levels (right). The white arrows represent prevailing wind direction.

First, at those desert latitudes, the Andes form a high and continuous wall and the prevailing winds are from the east, creating an especially strong rain shadow effect. Second, the subtropical high-pressure zone typically centered around 30 degrees has its usual drying effect, except that for complicated reasons again having to do with the Andes it’s more stable and extends farther north than along other west coasts. And finally, and probably most importantly, the cold Humboldt/Peru Current cools and dries the air all the way to Ecuador where the coastline starts to bend eastward away from the current. (Once again I’m drawing on my new favorite book, Trewartha’s The Earth’s Problem Climates, for most of this background.)

The absolute dryness of those deserts of course produces a heightened contrast with the wet climates to the north and south. But the northward extension of the dry zone (mostly due to the cold current) also means that on the northern side that contrast is compressed, so that the coastline between Southern Ecuador and central Colombia features the world’s sharpest rainfall gradient at sea level. You can see that to a degree in the maps above but I think it’s complex and interesting enough to deserve its own post—stay tuned for that.

In this post I’ll focus on the southern part of the pattern, from the Atacama Desert on the Peru-Chile border south to the temperate rainforests of Chiloé Island and the Carretera Austral (Chile’s southernmost coastal “highway”) in northern Patagonia. To go all the way to the southern tip of the continent by road would’ve required driving into Argentina, through higher and drier landscapes, in order to bypass the rugged intervening coastline. (Someday, though, it would still be nice to make a separate visit to that extreme.)

I made the 3700 km./2300 mi. journey (in fall 2019) by a combination of bus, car and ferry, with the exception of one air travel segment. My goal was to experience and photograph enough reasonably intact landscapes, at roughly even intervals along the route, to later be able to create either 1) a photographic transect of the gradient with only slight variation from one image to the next or 2) one of my fractured watercolor representations.

But as I mentioned in my “Long Gradients” series of posts, I’ve since realized that the fractured/abstract style doesn’t lend itself well to this scale and “linearity.” And even though I knew that having limited flexibility on the trip (for a few reasons I didn’t want to do the whole thing by rental car) would mean any attempt at the photographic transect would be superficial, it became even clearer that the concept can’t really work without using an interval less than, say, fifty miles. Particularly in such a topographically complicated region, where it’s hard to eliminate local variations to the large-scale climatic patterns without choosing the route very carefully, fewer images means less flattening out of those variations.

Map of ecological zones of Chile with photographic sequence.

The Chile “transect” and my generalized route (the plane travel segment is dashed), with climates/biomes (left) and rainfall levels (right). The trip extended a bit further south than the last image I ended up choosing, to the southernmost airport along the Carretera Austral.

So, to create the illusion of a smooth gradient I had to cherry-pick the images I included in the sequence. I ended up using only the six photos above, shot at not-so-even intervals—pretty far from the transect idea I originally had in mind. Obviously if I want to give this concept a serious try it’s going to take a lot more time and energy. But this attempt should still give a taste of the amazing variety along this route and what it’s like to try to take it all in.

Candelabra cactus in the Quebrada de Cardones in the barren Atacama Desert of Chile.

Candelabra cactus an hour or so east of Arica, in the Quebrada de Cardones.

The trip began in the town of Arica, Chile, from where I took a two-day excursion across the desert and up into the Andes (the overall north-south journey included a bunch of these side trips). In the lowlands the only visible vegetation is these unique and widely-scattered “candelabra” cacti, restricted to a tiny area along the Chile-Peru border.

River valley cutting through the barren Atacama Desert of Chile.

A river valley cutting through the Atacama.

I stayed in the desert for another week or so, making my way south by bus and taking a few more detours east and west (you’ll hear more about these later as they show up in some worldviews). For more than half the length of the Atacama, at low elevations, the landscape stayed essentially barren except around water sources.

In a zone centered very roughly around 30 degrees, the prevailing winds start to reverse direction so that they’re no longer blocked by the Andes. From there southward they blow over the cold ocean, presumably bringing less rain than they would with a warm current, but the lack of a mountain barrier is one factor determining the southern extent of the Atacama. Around the city of La Serena, cacti start to appear everywhere as the desert technically transitions to semi-desert, though it still looks very desert-like by North American standards.

Cacti in the desert near Bosque Fray Jorge in Chile.

Semi-desert in Fray Jorge National Park, a few hours south of La Serena.

I’m actually getting out of order—I’d planned my visit to Fray Jorge on a day when the park turned out to be closed, so I ended up driving all the way up there and back from Santiago on the very last day of the trip. (The worldview I’m currently working on is based on Fray Jorge; when I share it you’ll see why that park was a must-do.) But that detour had the advantage of forcing me to travel that segment of the trip by road, since I originally hadn’t been planning on it. I’d decided to fly from La Serena to Santiago after hearing that the drive isn’t particularly interesting; that turned out to be more-or-less true, but as you’ll hear more about in a moment it’s filling in the “missing link” that really matters.

Along the five-hour La Serena-to-Santiago drive (pretending that I’d done it in the right part of the itinerary) the landscape is mostly agricultural, but in the distance you can see more and thicker forest appearing on the mountainsides. In the Santiago/Valparaiso area the best place to see the matorral (subtropical shrubland, or the Chilean version of chaparral) is La Campana National Park, partly because one of its valleys contains the last significant population of the endemic Chilean wine palm, Jubeae chilensis).

Chilean wine palms, or Jubaea chilensis, in La Campana National Park near Santiago, Chile.

La Campana National Park with Jubaea chilensis.

La Campana’s latitude is roughly that of L.A. and this part of the park feels a lot like Southern California. Large cacti are still common this far south; and, while they’re usually associated with humid climates, bromeliads seem to fill the North American niche of yuccas and agaves here and even in drier spots to the north.

Cacti and bromeliads in La Campana National Park near Santiago, Chile.

Cacti and bromeliads in La Campana..

From Santiago I flew to Temuco, in the northern part of the wet temperate zone, with the closest airport to Villarrica Volcano and other sites in the Lake District. This region is still too far north for rainforest but was shockingly green after I’d spent so much time in the dry half of the country. This seemed to be a good portion of the trip to do by air since nothing between the two cities had jumped out as a must-see, but I immediately regretted that decision after feeling like I’d been dropped onto a different planet. It felt unmooring to a degree that I briefly considered trying to somehow squeeze that 9-hour drive into the last few days of the trip along with the 10-hour drive to and from Fray Jorge. I gave up on that possibility but, learning that there are in fact a few national parks straddling the dry-subtropical/wet-temperate divide within that segment, I decided it would just need to happen on a future trip. (The urge has quieted a bit since then.)

To fill that missing ecological link in the transect I needed to cheat—by using an image from the wetter, south-facing slopes of La Campana, back near Santiago, which I imagine to be reminiscent of the transitional landscape toward Temuco. (It has more of a Northern California look to it.) So much for the goal of even intervals and minimal topographic influence.

Forest in La Campana National Park near Santiago, Chile.

Forest on the southern slope of La Campana.

The next image comes from the forest around the base of Villarica Volcano—again I don’t think it’s technically rainforest, but it did feel dramatically different from anything earlier in the trip. Now with a much better overview of Chilean vegetation than I had back then, I realize that this landscape might not really belong in the sequence either; it’s at an elevation of over 1000m and so is probably shaped by altitude to some degree. The forest is mostly beech, typical of mid-elevation forests in this part of the country and closer to sea level farther south. Precipitation-wise it’s probably in the right position in the sequence, but if I were to go back I’d try to visit some natural areas closer to sea level.

The final, rainforest portion of the trip branched off in two directions, with a combination of bus and ferry travel—the first to the Pacific coast on Chiloé Island and the second down the Carretera Austral along an inland waterway (entering northern Patagonia). Most of this region receives more than 200mm./80” of rain annually, with over 120” on the west coast of Chiloé and at higher elevations on the mainland. I chose to officially end the transect on Chiloé because it features that extreme at, finally, a sea-level location.

Temperate rainforest near the coast on Chiloé Island. This is probably second-growth forest; the island’s most intact landscapes aren’t easy to access, especially during this period of nearly constant rain when trails were largely flooded.

Path through lush temperate rainforest on Chiloe Island, Chile.

A boggy part of the forest, including (on the right) some of the country’s southernmost bromeliadshere in their more expected forest habitat, creating a tropical look. (Having spent time here and in New Zealand/Tasmania, I think that our Pacific Northwest rainforests missed out.on a lot)

Interpretive display of mythical creatures in lush temperate rainforest of Chiloe Island, Chile.

Chiloé’s chilly, water-logged, often stunted forests have an evocatively gloomy aspect that’s inspired some creepy mythology.

Along the Carretera, at least according to the maps, there isn’t such saturated forest near sea level. But since I was able to visit some old-growth there that was no less evocative, I’ll share some of that too.

Giant Alerce cedar trees in lush temperate rainforest in Pumalin National Park in Patagonia, Chile.

Pumalin National Park, with giant Alerce cypress (related to redwoods).

Lush temperate rainforest with moss and ferns in Queulat National Park in Patagonia, Chile.

Upper elevations of Queulat National Park.

Waterfall in lush, foggy temperate rainforest in Patagonia, Chile.

Along the drive.

So if I were to do this trip again, aiming for a lot more volume and nuance with the imagery, I would spend much more time in the transitional zones between the shrubland/mattoral and the rainforest. That would take quite a bit more logistical creativity; having an “in-between” character, these forests are probably considered less evocative than the landscapes to the north and south and so aren’t made as accessible or might be less likely to be protected in the first place. Plus, the mild climates of these zones are particularly amenable to agriculture and urbanization.

Next time, to the north side of the desert….

Darren

Climate Journeys | Real World

In my last post I went into the idea of generic global climate patterns and the ecosystems/biomes they generate, and resulting “journeys” that might be taken across three particular types of patterns. Here I’m going to translate that approach to the actual globe.

First, to summarize those ideas from last time, below is a composite diagram of a generic Northern Hemisphere continent (picture a mirror image in the Southern Hemisphere). This time I’ve modified the zone labels a bit to merge their climatic (in bold) and ecological components. Also, to simplify things from here on I’ve merged the original three “West Coast” journey types into one.

So the three types are now:

  • East coast—a generally linear north-south gradient defined primarily by temperature.

  • West Coast—more complex and less linear than along East Coasts and defined more by precipitation than temperature, partly because temperatures in the three mid-latitude zones are moderated by oceanic influences. But there is a sharp contrast in both precipitation and (winter) temperatures, conveyed by the color contrast, between the Subpolar Rainforest and Polar Tundra zones. (I mentioned last time that this contrast hardly ever occurs in the real world without a mountain barrier, which would make it less relevant in this “long gradients” context, but it occurred to me that you can always find that contrast at sea level if you just stick to the coastline.)

  • Cross-Continental—a precipitation gradient from wet to dry, connecting the mid-latitude portions of the East and West Coasts. (The diagram shows the arrow beginning in the Subtropics, but it could begin in the Temperate zone too with a similar effect.)

Below is the generic pattern applied to the real continents, with the same biome types and color scheme. (Highland/mountain areas, which again I’m generally leaving out of the discussion, are shown in light grey. In this particular classification system they’re considered their own climate type even though they contain compressed versions—sound familiar?—of the large-scale patterns.) Overall, the generic pattern is still legible even though its distorted and sometimes disrupted by more localized conditions.

Global climate zones/biomes. (Adapted from https://kkh.ltrr.arizona.edu/kkh/climate/images/Trewartha.map.lrge.fix.jpg, with my own colors and some creative license with the eastern Black Sea coastsee below.)

Now I’ll focus on each of the three journey types, where they do occur and where they’d be expected to but don’t. You’ll see that many of my arrows join disconnected pieces of continents like Iceland and the UK, stretching the concept of “journey” a little bit, but that’s partly to emphasize that these patterns tend to be intact even across intervening water. Plus the fact is that, if we’re talking about native ecosystems, these patterns can only be experienced today as archipelagos anyways since those ecosystems have been broken up and mostly replaced by altered landscapes.

My main source for trying to understand the exceptions to these overall patterns is The Earth’s Problem Climates (by Glenn Trewartha, who also developed this particular climate classification system)—some of you won’t be surprised to hear me say that it’s become one of my favorite books ever. That’s despite that fact that, without a very deep knowledge of climatology or meteorology, it’s hard for me to get more than the overall gist of the explanations. They have a lot to do with seasonal variations in the strength, location, and orientation of winds and currents, adding much more complexity to the overall conditions I wrote about last time, interacting with topography and the shape of coastlines. In fact this complexity means that the primary causes of the anomalies rarely seem to be well understood. So I won’t try to give more than a basic idea of why the three typical patterns don’t always apply. (I still do get into the weeds a bit though, so just stick to the graphics if you’d like to skip the explanations.)

East Coast

Here’s the world map again showing only the zones making up the “East Coast” pattern/journey type. (From here on I’m going to ignore the Polar Ice Caps, since realistically if you were going to try and travel these routes you’d probably leave those out.)

“East Coast” climate zones/journeys. As with the generic continent a few of these zones do extend coast-to-coast.

The pattern exists in its complete form in Northern Hemisphere where significant lengths of east coast exist (so that leaves out Europe and northern Africa). But that isn’t the case in the Southern Hemisphere, as I’m suggesting with the thinner arrows. All of this is shown more clearly and diagrammatically below. I’ve lined up all the “East Coast” zones and, corresponding with the map above, colored them in (where that zone is present) or left them blank (where it’s absent) for each of the earth’s three main north-south “axes”:

The main reason for all the white space in the Southern Hemisphere, where the pattern doesn’t extend further south than the subtropics, is of course that there’s less land toward the south pole. But that doesn’t explain everything:

  • South America reaches nearly to Antarctica, but you can see in the map of global climate types that, south of the Subtropical Forest zone, instead of the continued forest-to-tundra progression is the Patagonian Desert. That’s partly due to the rain shadow effect of the Andes, stripping moisture from winds blowing off the Pacific, but it’s also because of the narrowing of the continent at that latitude. The temperate zones of eastern North America and Eastern Asia are wet much less because of the oceans to the east (there the winds generally blow toward those oceans, not off of them) than because of rainfall from other sources (in North America that’s mostly the Gulf of Mexico). But in South America there isn’t enough land to the east for those sources to take effect. The Patagonian desert is somewhat analogous to the semi-arid Great Plains in North America, though the Andes make it even drier.

    (There’s another anomaly that’s less relevant because it sits near the equator between the two arrows but you may have noticed it—a piece of semi-desert on the northwest coast of Brazil where there would otherwise be rainforest. It isn’t because of topography; apparently the Southern Hemisphere high pressure zone (normally around Patagonia) shifts northward during the southern winter, and then for complicated reasons a piece of it gets “stuck” there for the remainder of the year.)

  • In Africa the anomaly is toward the equator, where the Somali Desert and the East African savannas replace the tropical rainforest zone (except at high altitudes). Here the winds blow mostly from the east, which ought to bring moisture, but the winds and ocean interact in complicated ways that bring less rain than you’d expect.

  • Australia extends a bit further south than Africa and seems like it would have a Temperate Forest zone. But since the ocean wraps around to the east, the winds from the west bring an oceanic influence (part of the “West Coast” pattern) to the southeast coast—hence the white space. (This happens to a much more limited extent at the southern tips of South America and Africa, probably because of subtle differences in wind direction combined with the shape of the land.)

West Coast

With the ”West Coast” pattern, the three north-south axes incorporate all six non-polar continents and the pattern overall is more filled-out than the “East Coast” type. It extends from end-to-end along the west coast of the Americas; in Africa again it’s cut off on the south end but Europe fills it out completely on the north end. (In case you’re wondering, Iceland does have some tiny pockets of Subpolar Rainforest, even if the trees are only a few meters high, and once had a lot more. The “Celtic Rainforests” of Ireland and the UK aren’t much more widespread, but many so-called “sacred groves” fit into that category.)

The third axis is shorter and also a bit more convoluted. Asia doesn’t have much of an obvious west coast—it’s stretched over a wide longitudinal distance, so the pattern runs more diagonally. The Southern Hemisphere half is again cut off at the bottom in Australia, and (as I mentioned above) the southernmost part of it wraps over to the east coast.

“West Coast” climate zones/journeys. (Note the Eastern Black Sea coast is classified as Subtropical Forestpart of the “East Coast” typein the Trewartha system but as Temperate Rainforest on other maps. Since it is in fact a rainforest and is on the west coast of a landmass, I’ve gone with the latter designation.)

Cross-Continental

This third type connects the wet temperate or subtropical zones of the “East Coast” pattern to the desert zones of the “West Coast” pattern, and it’s mostly predictable where those other two patterns occur predictably. It’s absent in northern Africa because there’s no “east coast” at that latitude; but, since the Arabian/Iranian/Central Asian deserts represent an eastward extension of the Sahara, the transition to wet is essentially pushed eastward to China (and also northward by the Tibetan Plateau). You might notice there’s a reversal of the pattern (becoming dry-to-wet) between Central Asia and Europe; more on that in a later post.

I’ve shown Australia with an empty rather than solid arrow because though the right progression is there, technically the Great Dividing Range (the grey dashed line) disqualifies it from my list. I’m focusing on journeys where elevation change is imperceptible or has an insignificant effect on the pattern, and the rain shadow effect of The Great Dividing Range is at least part of the reason the forest-steppe boundary occurs where it does. But I’m making an exception since those mountains are relatively low, and Australia does round out the map nicely….

“Cross-Continental” climate zones/journeys.

I was originally going to end this post by zooming in even further on a few of these regions, bringing in some more evocative imagery than just maps and diagrams, but I think this is enough for now. More next time!

Darren

Climate Journeys | Introduction

Early last year I wrote a series of posts on “long gradients,” inspired by the dry-wet transition on a drive from California to Maine and back; this next series will pick back up on that theme, zooming out to the entire globe.

First, a quick recap of the “long gradient” concept. Having grown up in the relatively climatically uniform Midwest I think of these large-scale transitions, extending over many hundreds of miles, as more “typical” than the more rapid and more easily experienced kind generated by topography. My worldviews focus on the latter, “compressed” type, because by definition they’re better at eliciting that “world-at-my-fingertips” feeling that I go on and on about. They also lend themselves better to being captured and accentuated on paper. But the large-scale kind can have a similar impact if you travel them quickly enough. (A car works if you don’t stop very frequently, but for me this would also be a side benefit of having more widespread high-speed rail.) And if you are maximizing speed, in a sense that impact can be even greater than for the small-scale kind because you’re covering a distance that’s still continental or global in scale. Time is being compressed without compressing space.

Global Climates: The Typical Pattern

Needless to say plenty of these long gradients exist across the globe, and they can be grouped into some broad categories based on whether they’re created by variations in temperature, precipitation, or usually some combination of both. But they can also be broken down further, and classified, into particular patterns that repeat across the different continents. It’s probably somewhat common knowledge that the same types of climates can be found in multiple places around the world—e.g. “Mediterranean” climates aren’t just found around the Mediterranean, and tropical rainforest climates are found in multiple places along the equator. But that also holds true for groupings or progressions of climate types, beyond the obvious transition from polar to tropical. You can start to see these patterns in the climatic map below, of a generic “continent” spanning both hemispheres. (I’ve chosen the colors to reflect degree of similarity.)

(This post will stay on this generic global level. It does get into the weeds a bit, but as a framework for looking at the specific places I’ll get into later on, the main points should be enough.)

There are different climate classification systems out there; this is based on the Trewartha system, though I’ve changed some of the names because I find the original terminology to be a little confusing/inconsistent. I’ve probably sacrificed some accuracy as a resultI think clarity’s more important here, but those of you who are into this stuff, don’t hesitate to call me out on it! (Diagram based on https://www.geocurrents.info/place/australia-and-pacific/australias-climatic-anomalies/attachment/hypothetical-continent-climate-map. )

Next, below is the typical ecosystem/biome corresponding to each climate type.

Driving Factors

Besides the expected north-south gradient, in the map you’re probably picking up on a differentiation between east and west that wouldn’t be explained by latitude—again likely familiar, but the more detailed distinctions and the reasons might not be. In a nutshell that differentiation is the result of variation in prevailing wind direction combined with ocean currents, related to the continental/oceanic distinction that I’ll explain below. Here is a quick (and simplified) overview of those and other major factors generating the pattern:

  • Solar angle (varies directly with latitude). This is the most straightforward one—highest angle at the equator (hence generally warmer air, which also holds more moisture), lowest angle at the poles (lower temperatures and less moisture).

  • Wind direction relative to ocean position. Having an ocean nearby always has some moderating effect, but more important is whether the prevailing winds blow off the ocean toward land (magnifying the moderating effect) or vice-versa. Wind direction (and atmospheric pressure, below) are largely determined by something called “atmospheric circulation cells”—themselves a function of solar angle, i.e. uneven heating of the atmosphere—combined with the rotation of the earth. Those two phenomena explain why prevailing wind direction varies by latitude.

  • Ocean currents. Just as uneven heating of the atmosphere determines air flow patterns, uneven heating of the oceans generates analogous flows underwater. They’re warm or cold based on the latitude where the water originates. The strength of their effect on air temperature (and also precipitation, since warm air holds less moisture than cold air) over adjacent land is, again, largely dependent on wind direction.

  • Atmospheric pressure. The winds in those atmospheric circulation cells create alternating zones of high and low pressure roughly around the equator and 30° and 60° N/S. Low pressure (rising and condensing air) tends to increase precipitation, while high pressure decreases it.

Journey Types

Of course the generic map ignores the wildly varied shapes of continents and oceans, adding complexity to all of the driving factors above. And it ignores topography and elevation, which impact air circulation and temperature. So there are plenty of exceptions to the generic climate/biogeographic pattern, which themselves are interesting and I’ll get to some of them later on. For now though, the above factors generate what I classify into five typical “sub-patterns” or gradients that can theoretically be journeyed across, as indicated by the arrows below. (Again I’ve simplified the driving factors for the sake of clarity, making some assumptions in the process—if anyone wants to correct me, that only adds to the “intrigue”!)

  1. “East Coast” (along the east coasts of continents, all the way from the poles to the equator). As is clear from the map, the overall east coast progression of climates/biomes is more straightforward than along the west coast—temperature and precipitation both generally increase all the way from the poles to the equator in a relatively linear and consistent way. Basically this is because, due to prevailing wind direction, the ocean has relatively little influence at the latitudes where it matters.

    The prevailing winds blow in the landward direction at high and low latitudes where ocean currents are cold and warm respectively, doing little to moderate the cooling/drying and warming/moistening effects of latitude. At middle latitudes where the oceanic effect would be more “disruptive,” the prevailing winds blow off the land instead, and so the climate of that temperate zone is considered continental rather than oceanic. (There are complicated reasons why the mid-latitude high- and low-pressure zones seem to have much less influence on precipitation here than on the west side, generally specific to the shapes of the different continents.)

  2. “Temperate West Coast” (along the west coasts of continents, toward the equator from subpolar rainforest to desert). This progression of generally oceanic (also called maritime) climates contrasts directly with the continental progression on the east side. The prevailing winds, blowing off the ocean, strengthen the impacts of the warm current toward the poles and the cold current toward the equator, setting up a wet-to-dry precipitation gradient and moderating what would otherwise be a (latitude-generated) cold-to-warm gradient like along the east coast. So while average temperatures do increase moving toward the equator, the rainfall gradient is much more significant. The precipitation extremes are also magnified by the low-pressure zone at the pole-ward end and the high-pressure zone at the equator-ward end.

  3. “Tropical West Coast” (along west coasts, toward the equator from desert to tropical rainforest). This transition, almost entirely within the tropics, is defined by increasing precipitation from the high-pressure zone at the pole-ward end to the low-pressure zone at the equator. Since the prevailing winds blow off the land here, the cold ocean current doesn’t have the effect of counteracting the high rainfall generated by that low-pressure zone.

  4. “Polar West Coast” (along west coasts, from subpolar rainforest to the poles). At I’ve tried to indicate with the color choices, this transition is, theoretically, very abrupt in terms of both temperature and precipitation. Moving toward the poles, the wind direction shifts seaward, magnifying the effects of increasing latitude by mostly eliminating the temperature-moderating and moisture-providing influence of the ocean. I say “theoretically” because I don’t think there’s actually anywhere in the world where this pattern exists without the complicating influence of mountains (more on this later).

  5. “Cross-Continental” (from eastern forests to western deserts). As I said above the reasons the western arid zone doesn’t extend all the way to the east coast are partly continent-specific, having to do with the weakening of that high-pressure zone. Another explanation, though, is the drying influence of the cold current along the west coast, especially where the prevailing winds blow from ocean to land.

Next time I’ll bring these journeys more “down-to-earth,” tying them to some specific places.

Darren

Habitat

Before I take you to today’s destination, an announcement—I’m now on Spotify! And Apple Music, YouTube Music, and others…with The Last Island, my recent orchestral composition. Just an experiment really, plus I thought it would be fun to design an album cover.

It'll be a long-shot for this to get traction (these aren’t great platforms for classical/instrumental music plus I didn't compose the beginning to be an attention-grabber). But help me out if you can!—by liking, and listening to at least a few minutes. For Spotify, click here or on the image!

Now, to the Galápagos—specifically Plaza Sur (or South Plaza), an island I haven’t mentioned in my previous posts on the archipelago. This one is tiny and low, covering only about 0.1 square kilometer, so there’s no wet highland zone as with the others I’ve described. In this case the “edge” that drew me in was simply the edge of the island itself—that is, the “compressed” aspect of the place that I wanted to accentuate was the smallness of the landmass rather than a sense of downsized ecological/meteorological patterns. That it felt like its own miniature world, then, didn’t have anything to do with the “island-continent” phenomenon that I’d apply to the larger, ecologically diverse islands in the Galápagos (though that phenomenon is best and most commonly associated with the Big Island of Hawaii, with tropical and alpine in addition to wet and dry).

The miniature-world quality did, though, have something to do with the prominent animal life, maybe because it makes the environment seem more multi-dimensional and “complete” in its own way. Of course the Galápagos is most famous for its fauna, but as you know it’s the flora that usually catches my attention instead. (I sometimes jokingly refer to animals as “mobile life forms”—for some reason things that stay put, with the passage of time a less central or perceptible factor, are much more interesting to me. I pay more attention to fauna on the level of biogeography, since ranges of animal species are a lot more stationary than individuals. It might be analogous to my interest in buildings but not—in the least!—cars.) On Plaza Sur, though, the wildlife somehow comes across as a particularly integral fixture of the landscape. Maybe the animals seem to stand out more, or seem more confined and stationary (I said “fixture” on purpose), because of the smallness and sparseness of their surroundings. (Of course most of them move around quite a bit, including between islands, but my outlook is one of distilling and idealizing.) This greater-than-usual prominence of animals in my particular experience of the island is captured in Habitat, the first watercolor where I’ve incorporated them; the title itself reflects that greater inclusivity.

Abstract watercolor painting of the desert island of Plaza Sur, or South Plaza, in the Galapagos.

Habitat, watercolor on aquabord, 24”x36.”

The most eye-catching animal on the island, though less remarkable than its marine counterpart, is the land iguana—bright yellow to orange and feeding on the fruits and foliage of giant prickly pear cacti. Beyond that there’s plentiful bird and marine life, in the watercolor represented by swallow-tailed gulls and sea lions.

Giant Opunia echios cacti on the desert island of Plaza Sur, or South Plaza, in the Galapagos, with red vegetation and turquoise sea.

Giant Opuntia cactinot quite as giant as on some other islands in the archipelago but the only real tree on this one.

Yellow land iguana, Conolophus subcristatus, on the island of Plaza Sur, or South Plaza, in the Galapagos.

Land iguana (Conolophus subcristatus).

Watercolor sea lions and land iguana with prickly pear cactus pad on the island of Plaza Sur in the Galapagos.

Enlarged from the watercolorsea lions, and iguana guarding a cactus pad.

Watercolor swallow-tailed gulls on the island of Plaza Sur in the Galapagos

Swallow-tailed gulls.

Giant Opuntia echios cacti on the desert island of Plaza Sur, or South Plaza, in the Galapagos.

Like a few other works, this is one where the overall compositional pattern is meant to reflect some general quality of the place, in this case a diffuse/atmospheric one. The fragments are triangular or nearly triangular, and that angularity is meant to capture an overall aura of “sharpness”—spiny cacti, spikey iguanas, and hot/bright sunlight. The predominance of reds, yellows, and oranges (which I played up a little) in the iguanas and the creeping Sesuvium vegetation also reinforces that sensation of heat.

Habitat, the animated journey. The guided hike around the island follows a loop trail, beginning and ending at the jetty. As usual the form of the route is highly abstracted, modified to fit with the selected imagery.

Plaza Sur isn’t by any means immune to the archipelago’s many conservation challenges, but since it’s tiny and uninhabited, impacts can be relatively tightly controlled and monitored. One of those impacts has been a decline in the Opuntia cactus population due to local extinction of hawks that feed on the iguanas (which in turn eat the cactus fruits and limit the plant’s ability to regenerate). A project to re-grow the population is underway.

Darren